 Download:
Figures of the Article
-
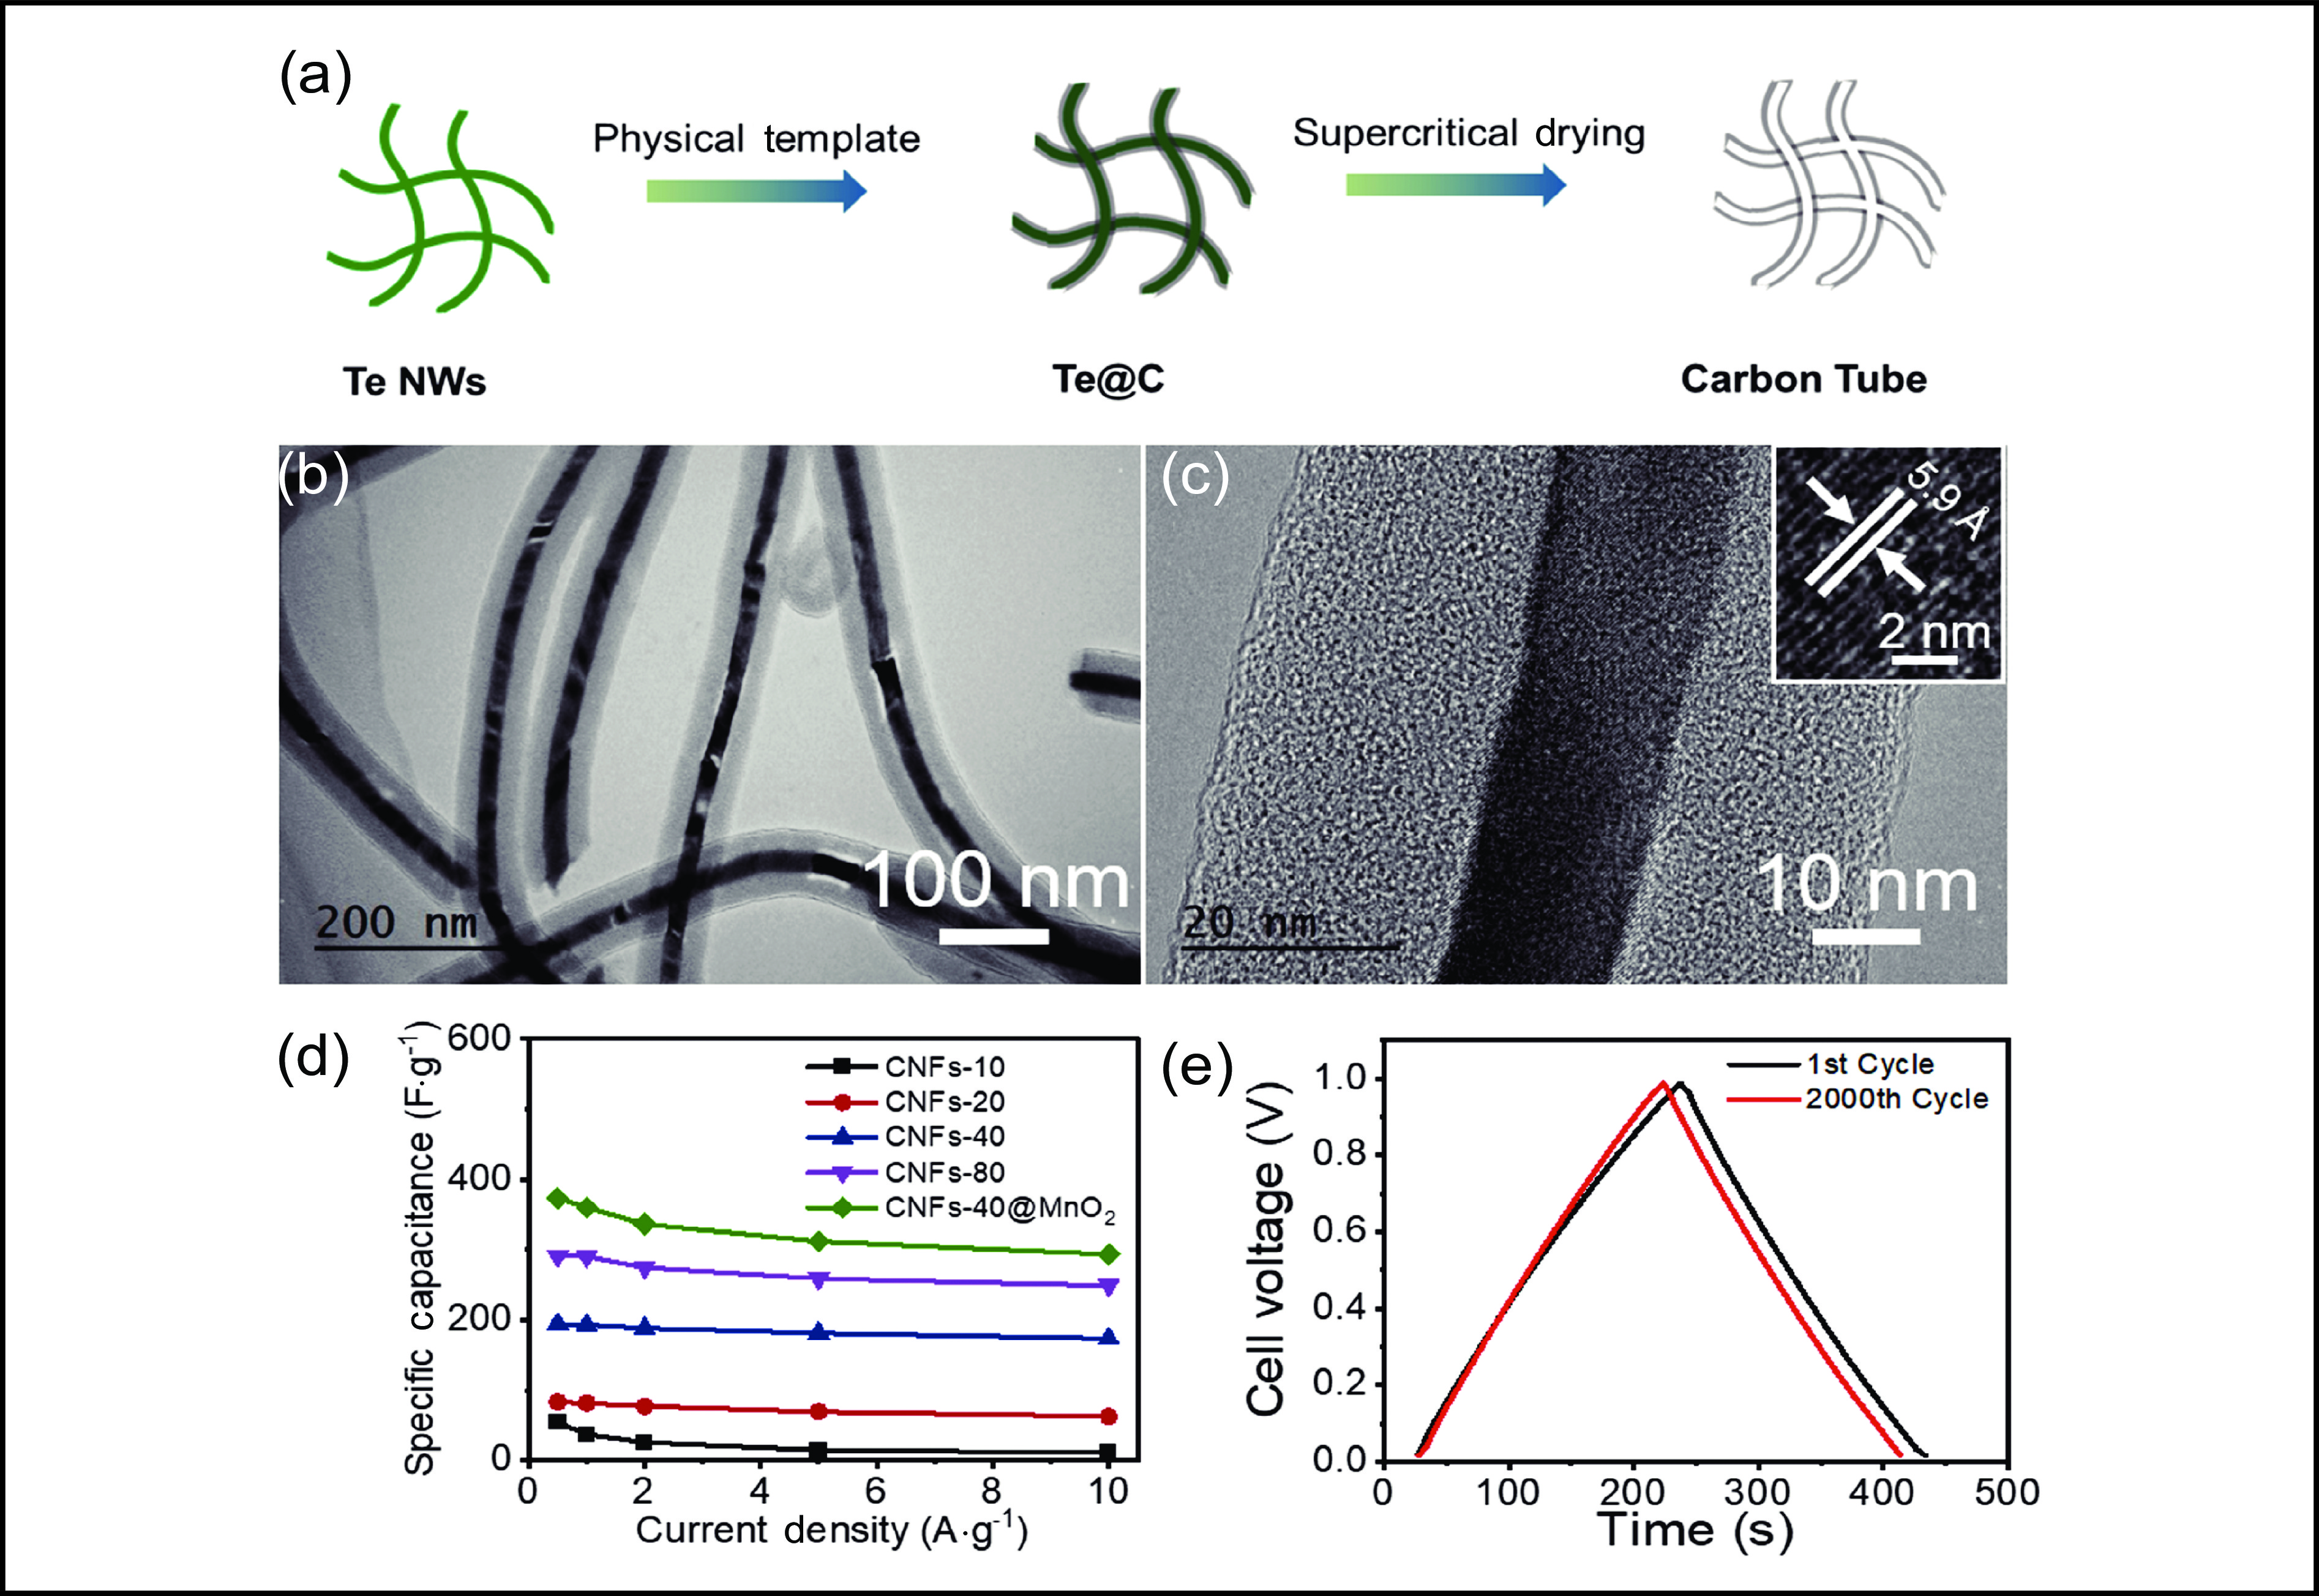
![]() (a) Schematic of the typical synthesis of the carbon tube. (b,c) TEM images of the Te@C fiber (Te NWs coated with a uniform carbon shell) at different magnifications. The inset of (c) shows a HRTEM image of the inner Te NW. (d–f) Maps of the Te@C nanocable. (g) Corresponding selected-area electron diffraction pattern of a Te@C nanowire cable.
(a) Schematic of the typical synthesis of the carbon tube. (b,c) TEM images of the Te@C fiber (Te NWs coated with a uniform carbon shell) at different magnifications. The inset of (c) shows a HRTEM image of the inner Te NW. (d–f) Maps of the Te@C nanocable. (g) Corresponding selected-area electron diffraction pattern of a Te@C nanowire cable.
-
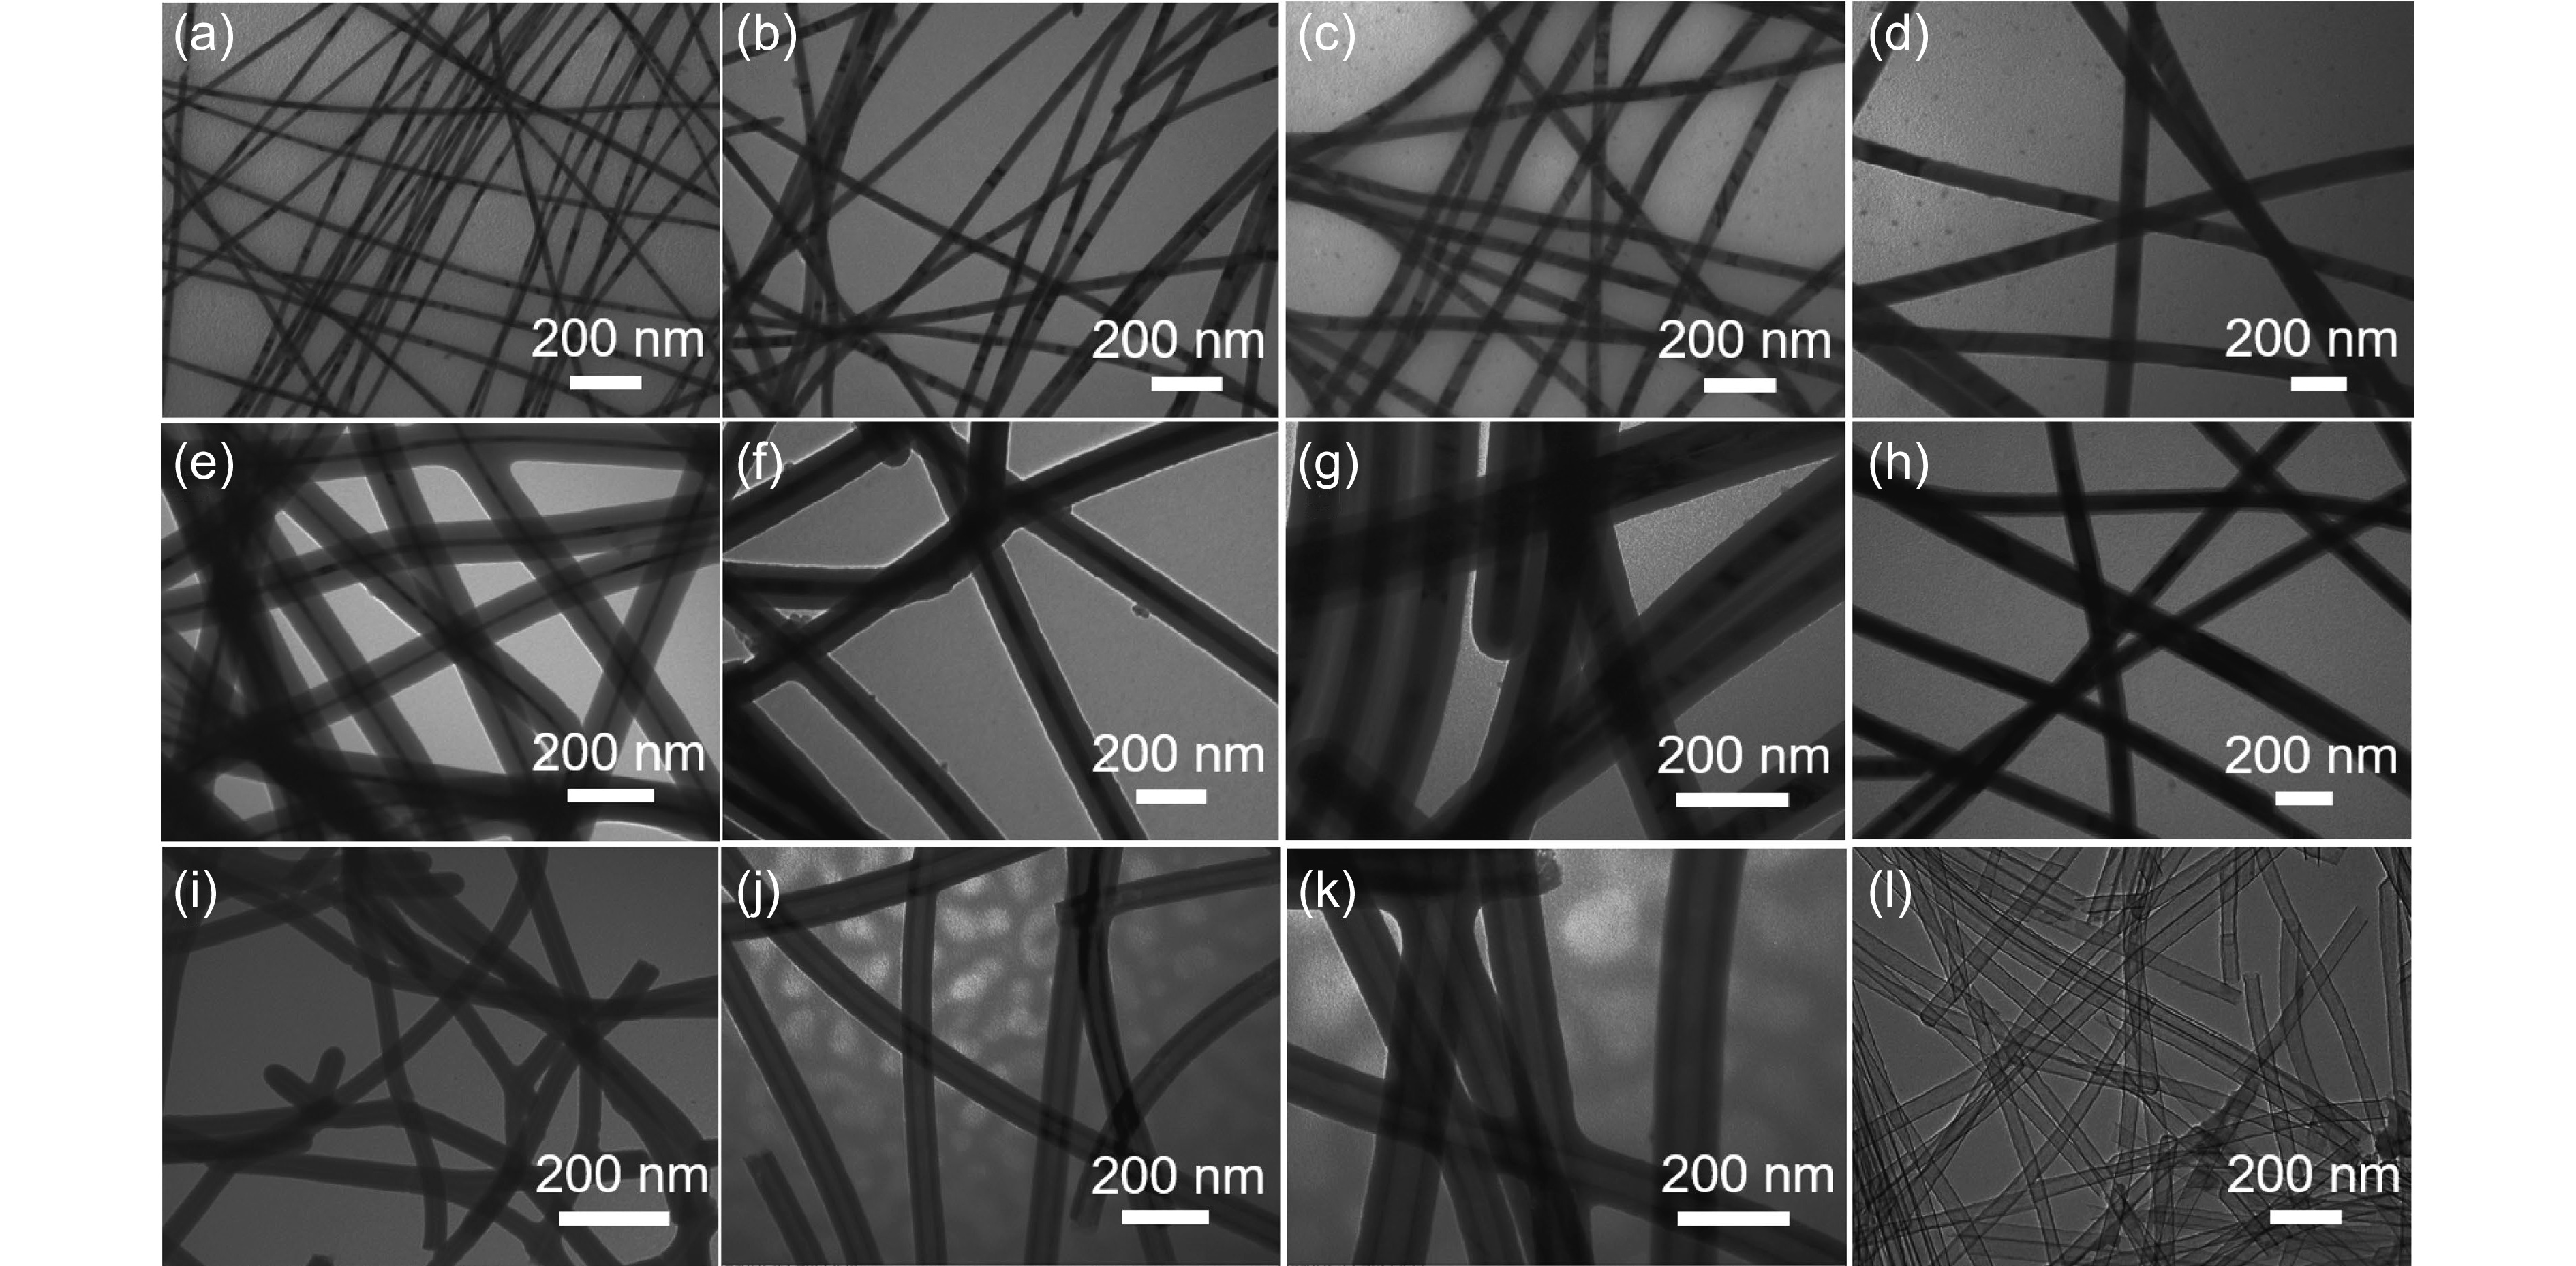
![]() Morphology control of the tubular carbon aerogel.
Morphology control of the tubular carbon aerogel.(a–d) TEM images of Te NWs with different diameters of 10, 20, 40, 80 nm, respectively. (e,f) TEM images of the Te@C fibers obtained with Te NWs with different diameters as templates. (i–l) TEM images of the carbon nanotubes with different pipe diameters and wall thicknesses obtained using the Te@C precursor (e,f) by a high-temperature annealing. -
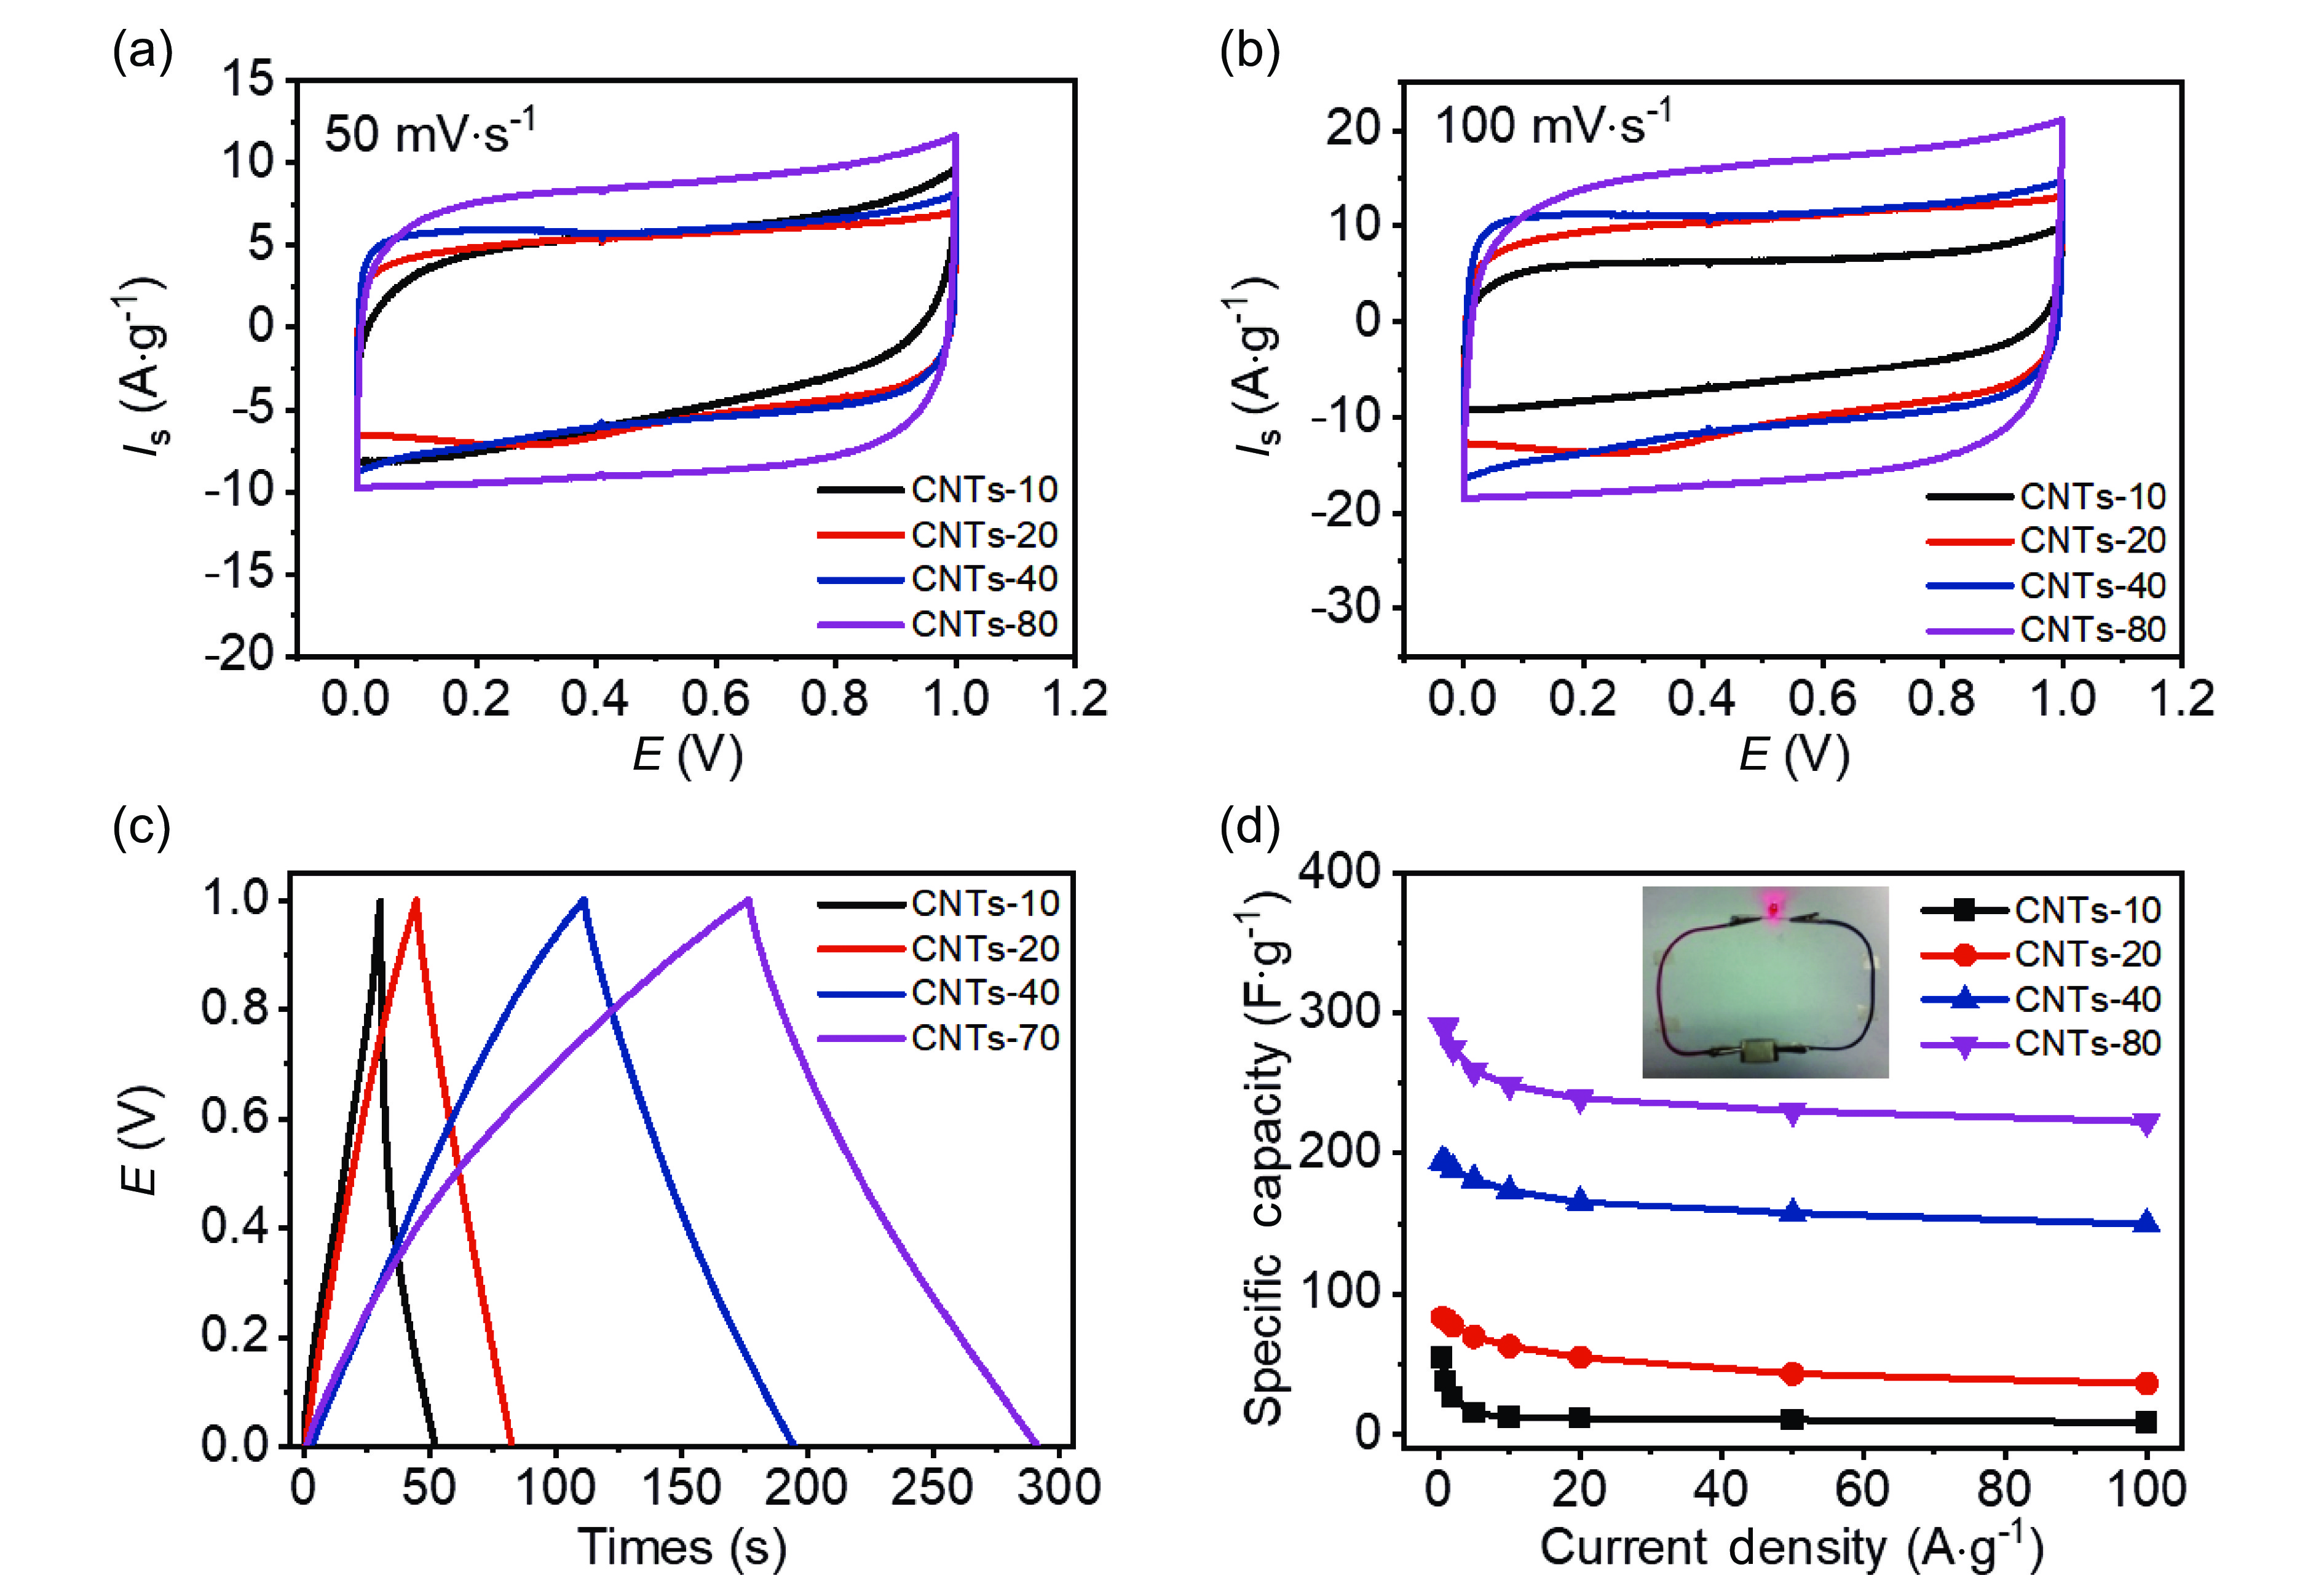
![]() Electrochemical performances measured in a two-electrode system. Cyclic voltammograms of the carbon nanotube-10, carbon nanotube-20, carbon nanotube-40, and carbon nanotube-80 at scan rates of (a) 50 mV∙s−1 and (b) 100 mV∙s−1. (c) Galvanostatic charge–discharge curves at 1 A∙g−1. (d) Volumetric capacitances at different current densities.
Electrochemical performances measured in a two-electrode system. Cyclic voltammograms of the carbon nanotube-10, carbon nanotube-20, carbon nanotube-40, and carbon nanotube-80 at scan rates of (a) 50 mV∙s−1 and (b) 100 mV∙s−1. (c) Galvanostatic charge–discharge curves at 1 A∙g−1. (d) Volumetric capacitances at different current densities.
-
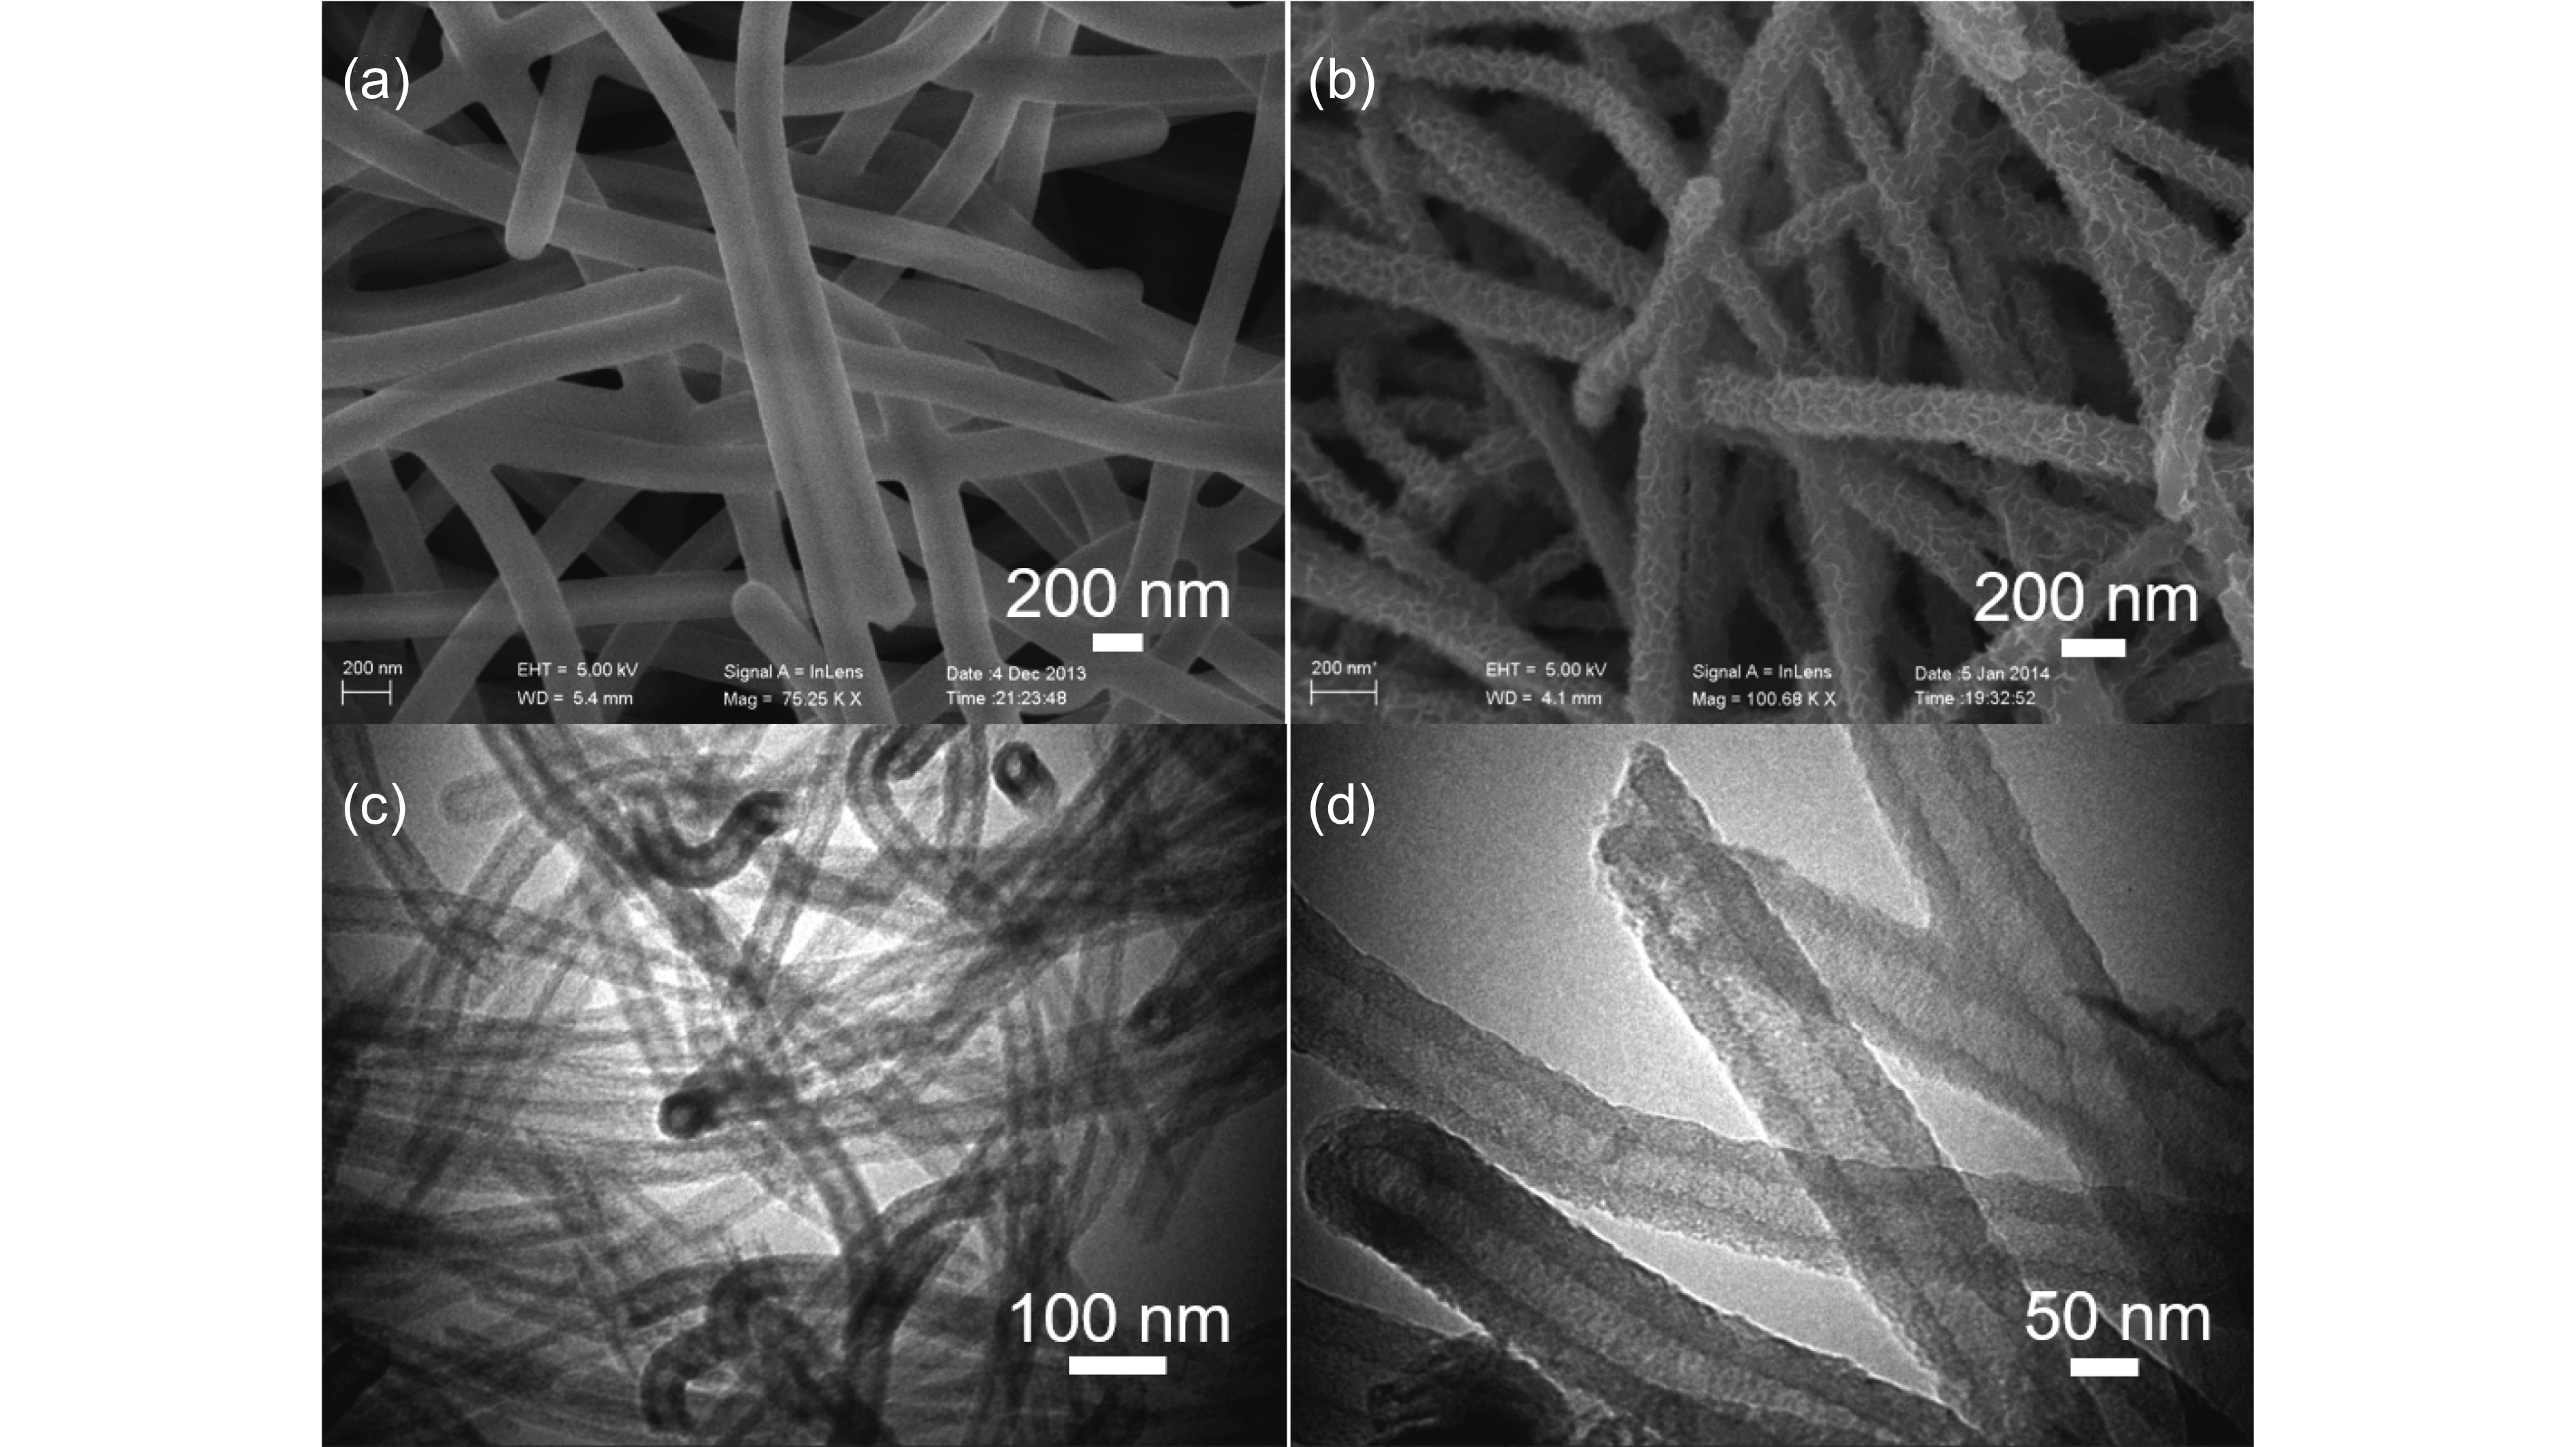
![]() (a) SEM image of the carbon nanotube-40. (b) SEM image of the MnO2@carbon nanotube-40. (c) TEM image of the MnO2@carbon nanotube-40. (d) TEM image of the MnO2@carbon nanotube-40 at a high magnification.
(a) SEM image of the carbon nanotube-40. (b) SEM image of the MnO2@carbon nanotube-40. (c) TEM image of the MnO2@carbon nanotube-40. (d) TEM image of the MnO2@carbon nanotube-40 at a high magnification.
-
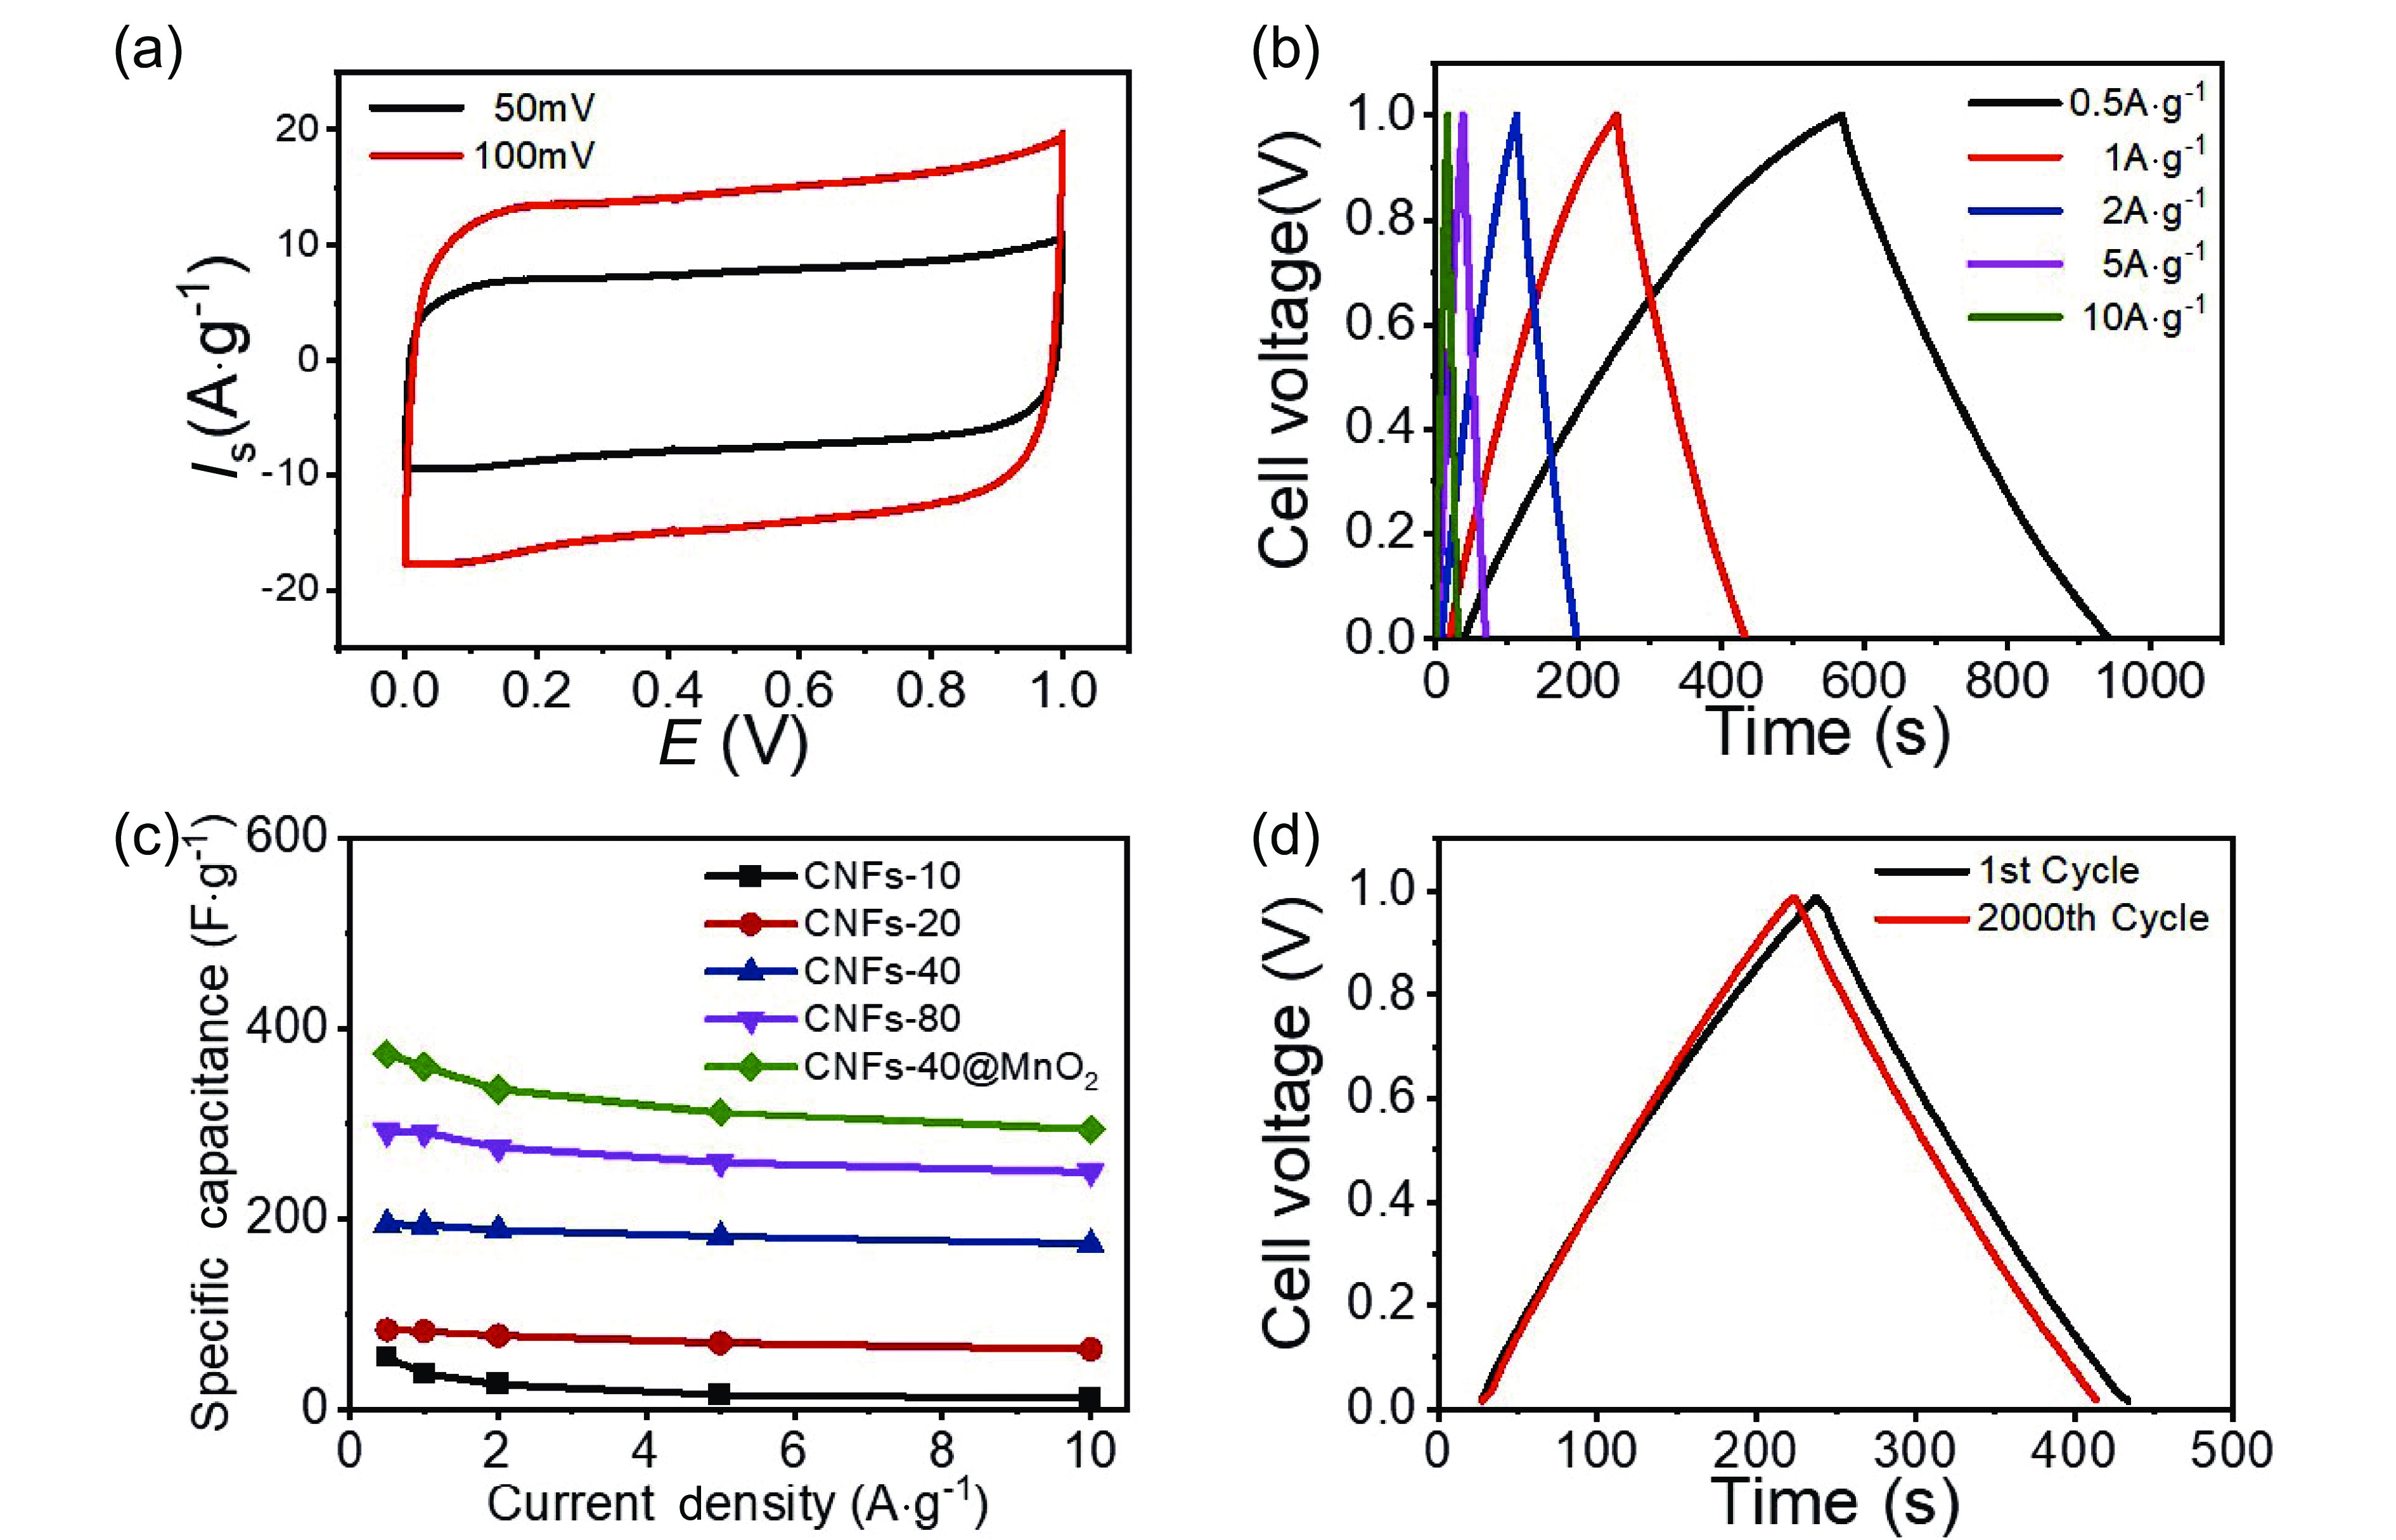
![]() Electrochemical performances measured in a two-electrode system. Cyclic voltammograms of the MnO2@carbon nanotube-40 at scan rates of 50 and 100 mV∙s −1. (b) Galvanostatic charge–discharge curves of the MnO2@carbon nanotube-40 at different current densities. (c) Volumetric capacitances of the MnO2@ carbon nanotube-40 and carbon nanotube-x (x = 10, 20, 40, 80) at different current densities. (d) Triangular shapes of the first and 2000th cycles.
Electrochemical performances measured in a two-electrode system. Cyclic voltammograms of the MnO2@carbon nanotube-40 at scan rates of 50 and 100 mV∙s −1. (b) Galvanostatic charge–discharge curves of the MnO2@carbon nanotube-40 at different current densities. (c) Volumetric capacitances of the MnO2@ carbon nanotube-40 and carbon nanotube-x (x = 10, 20, 40, 80) at different current densities. (d) Triangular shapes of the first and 2000th cycles.