
 Download:
Figures of the Article
-
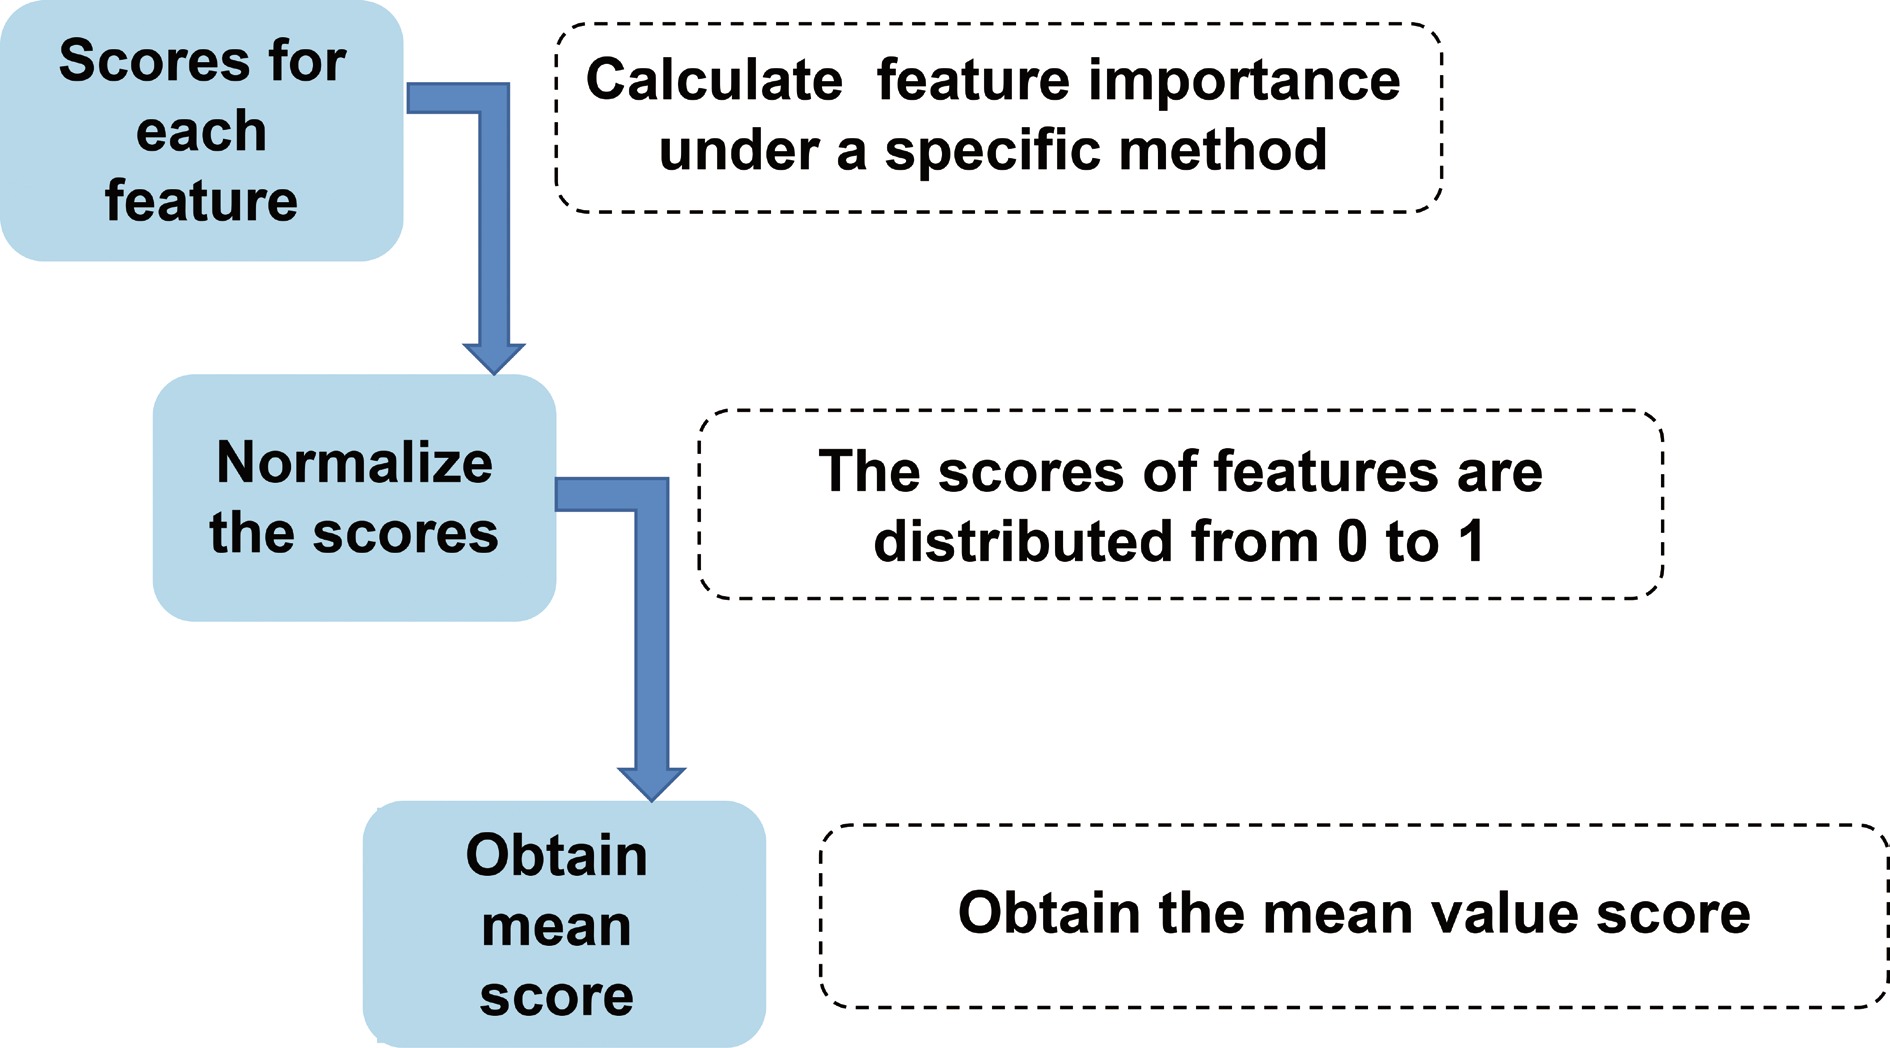
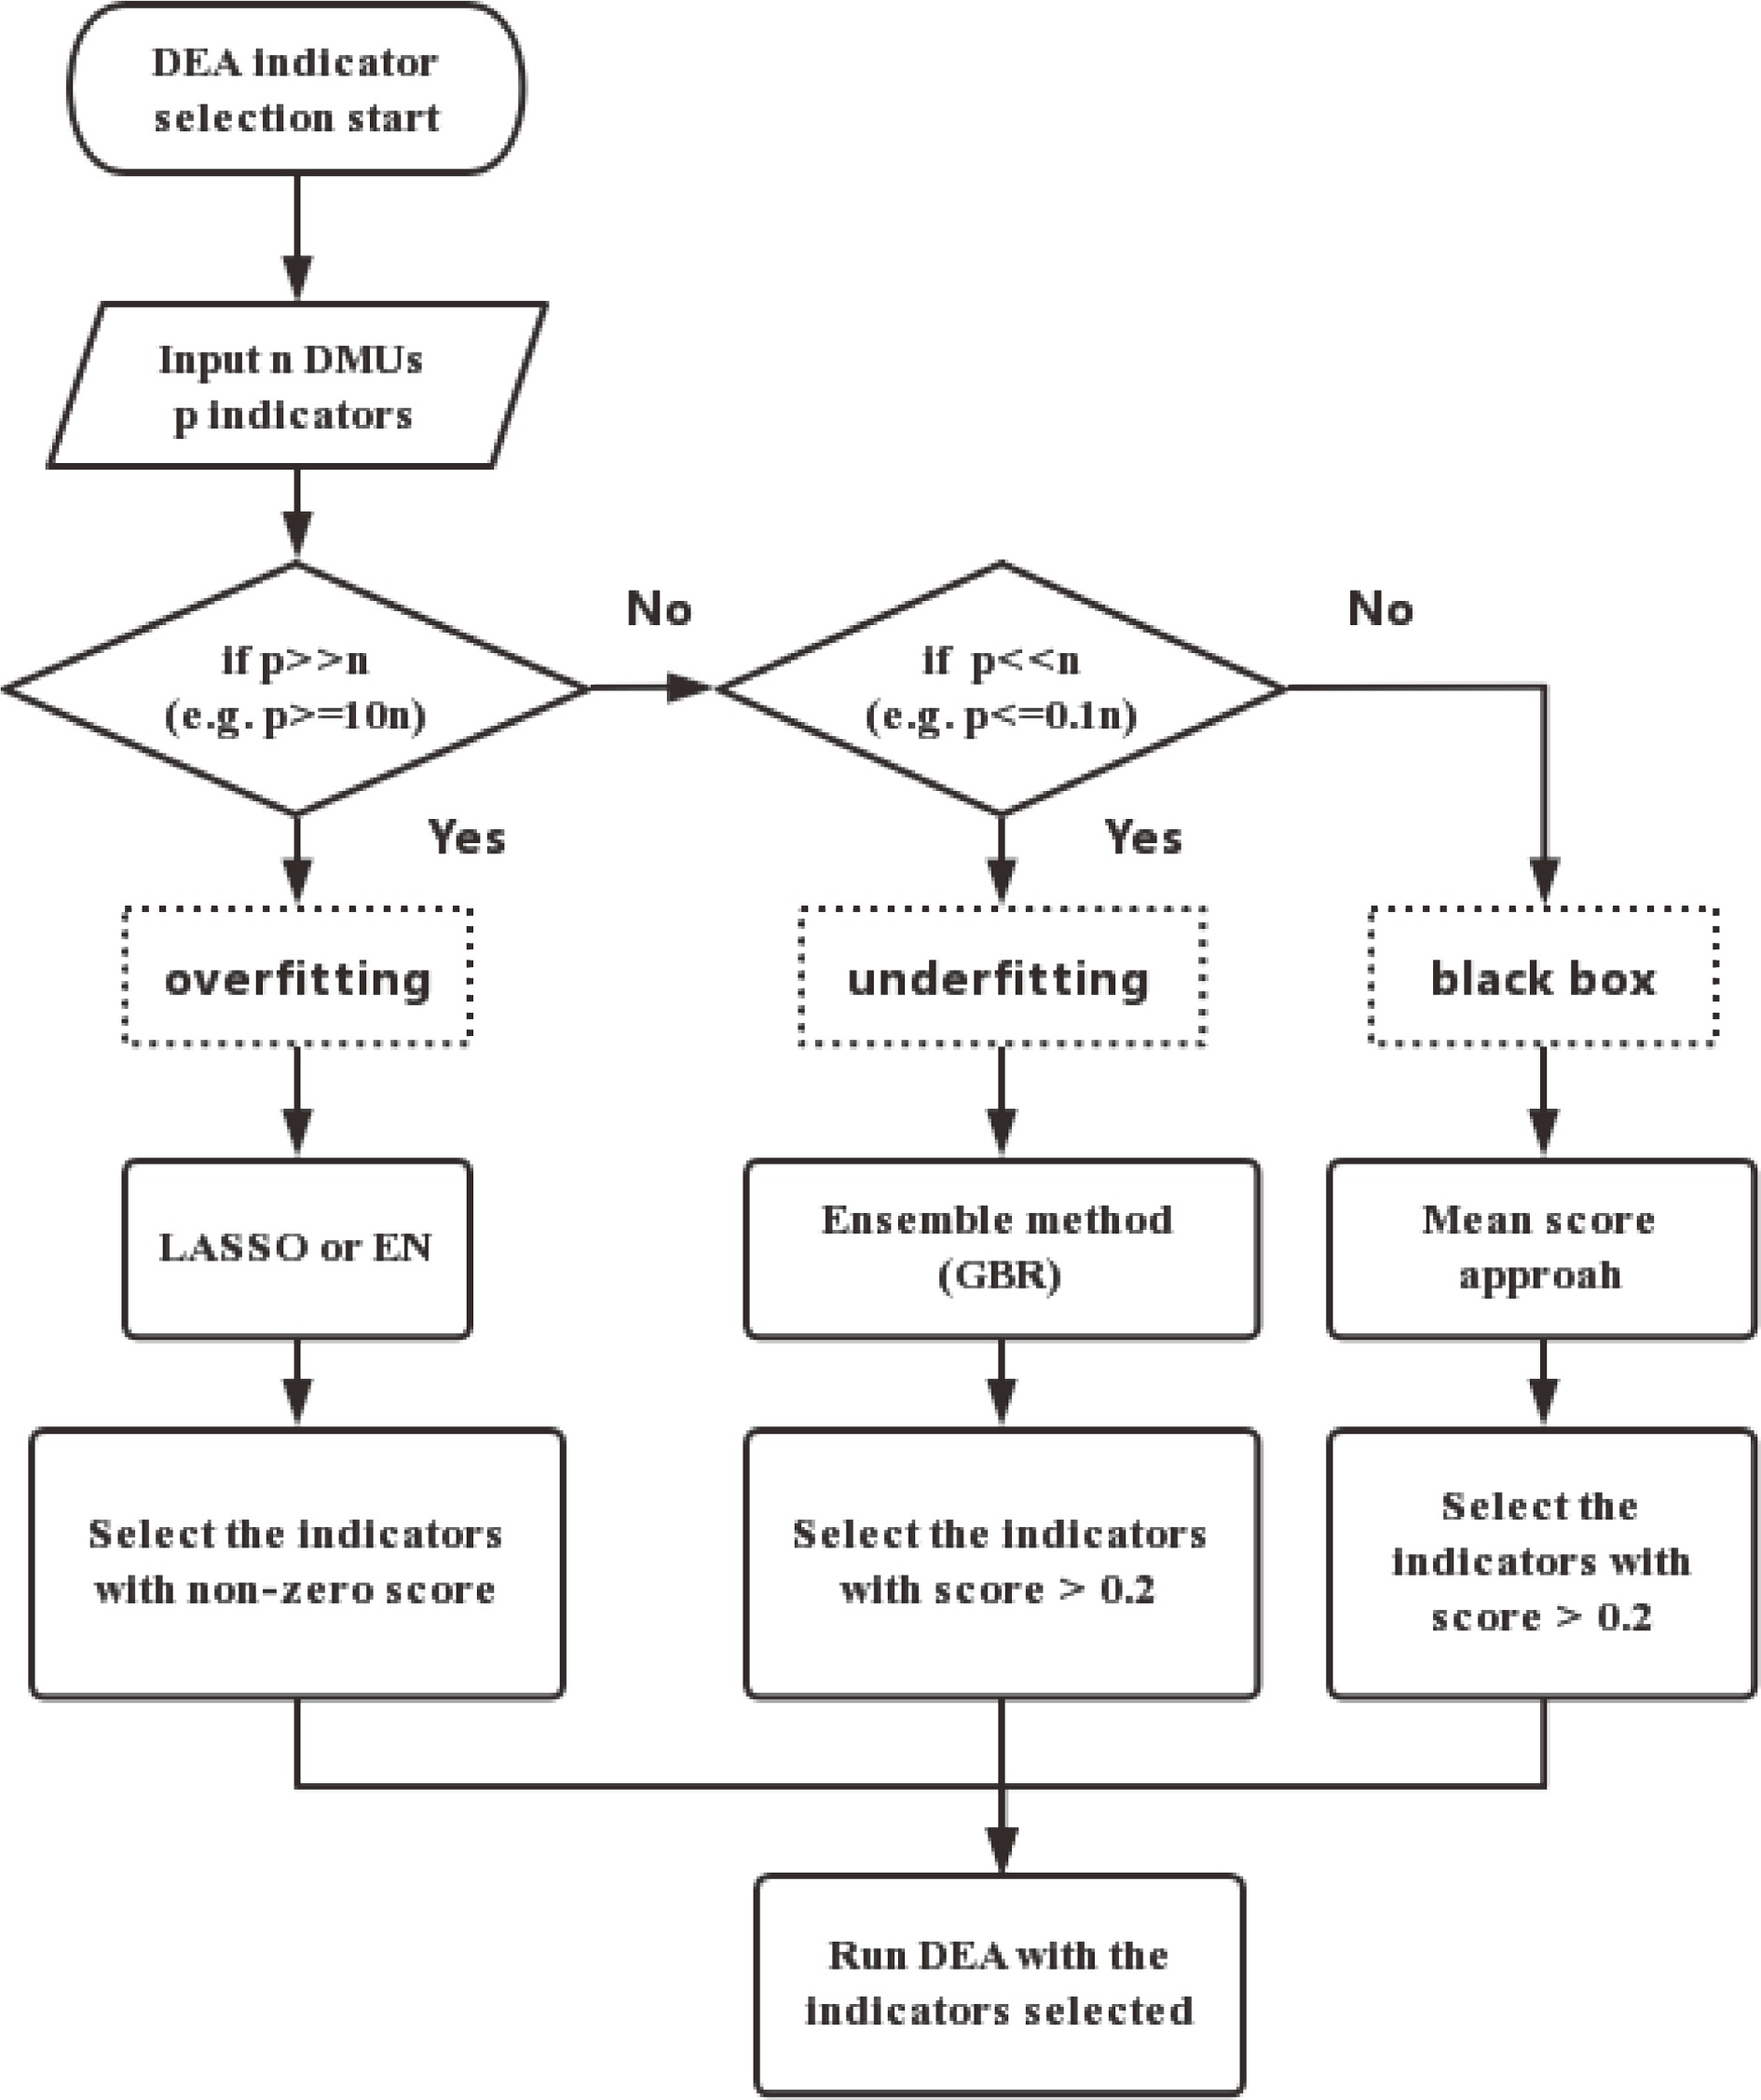
![]() Flow chart for the mean score methodology.
Flow chart for the mean score methodology.
-
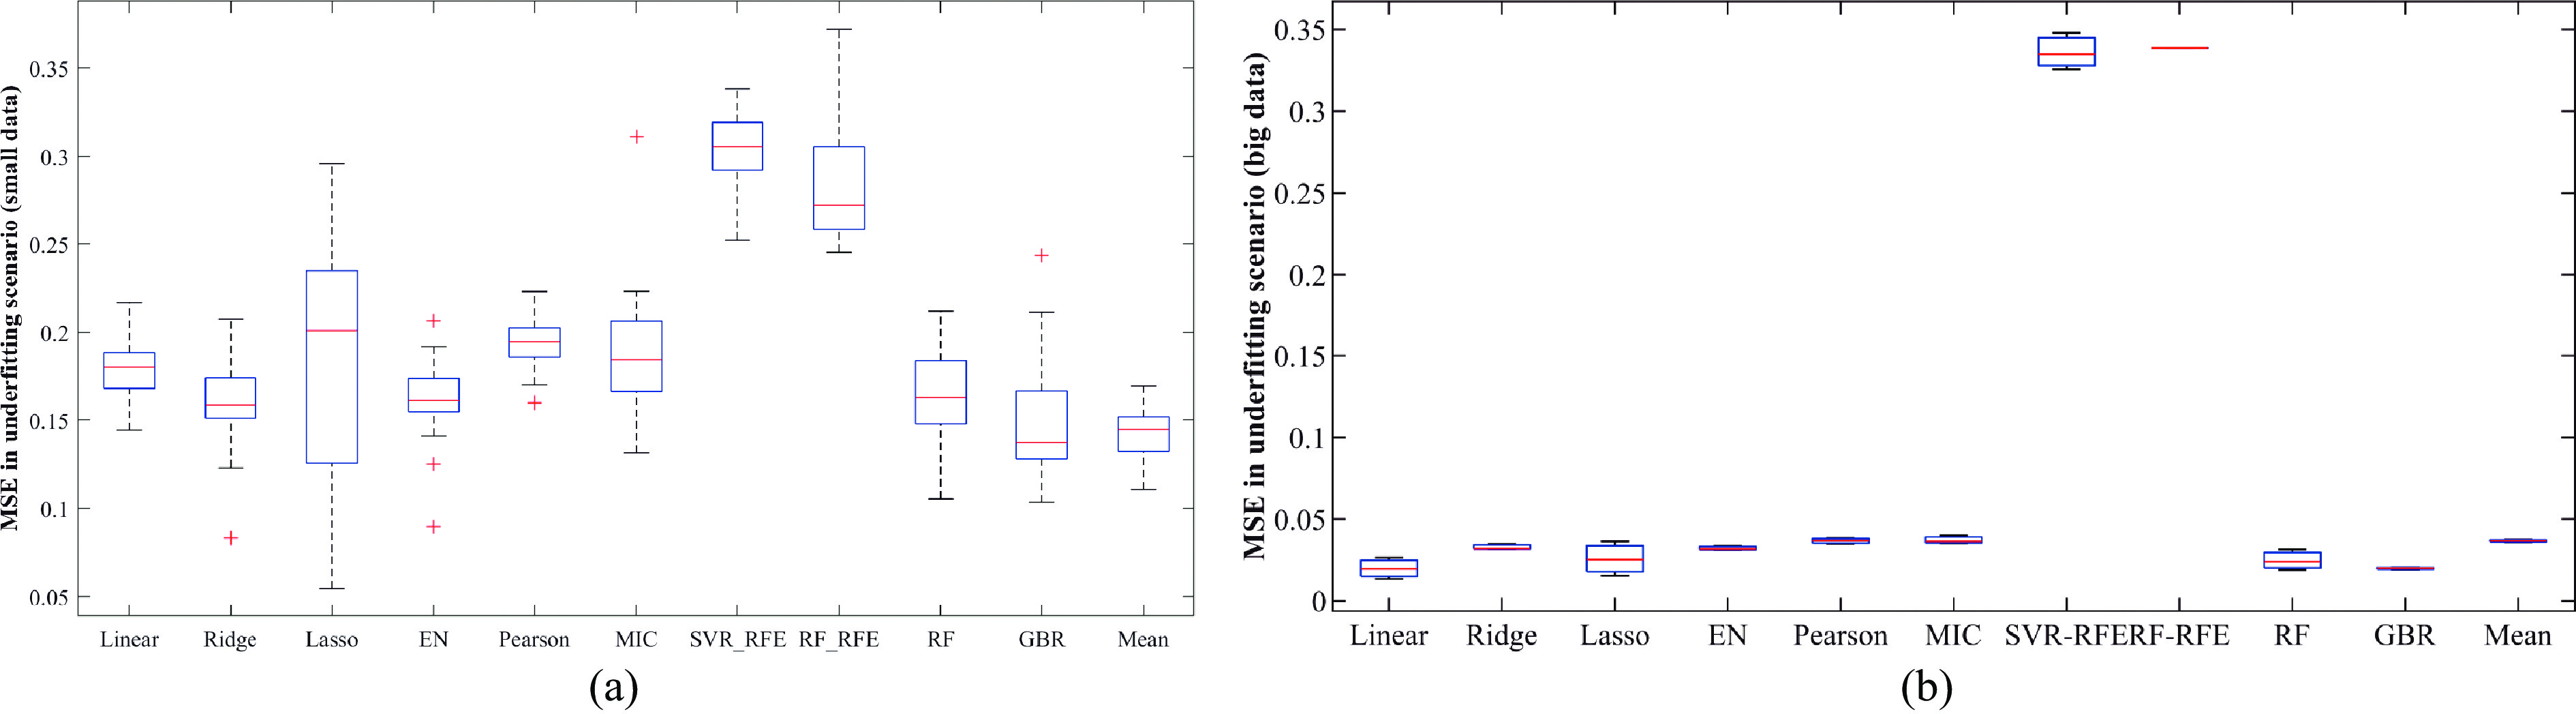
![]() Comparison of indicator identification ability of methods in underfitting scenarios.
Comparison of indicator identification ability of methods in underfitting scenarios.
-
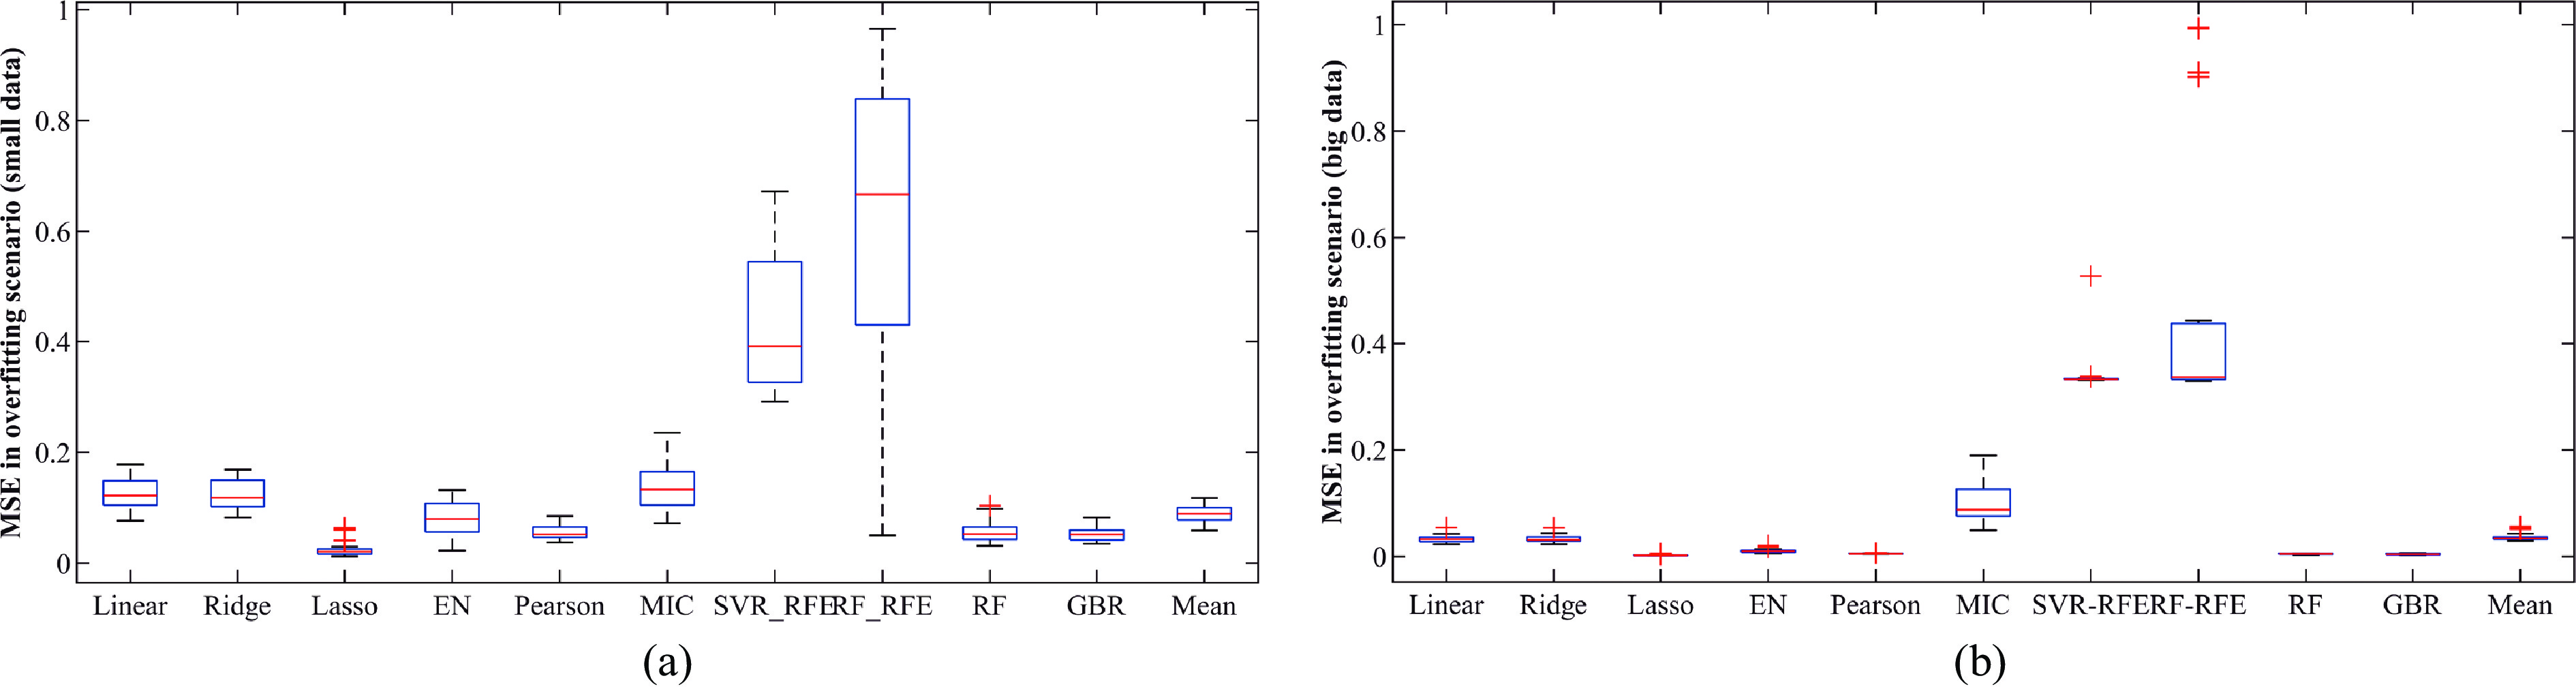
![]() Comparison of indicator identification ability of methods in overfitting scenarios.
Comparison of indicator identification ability of methods in overfitting scenarios.
-
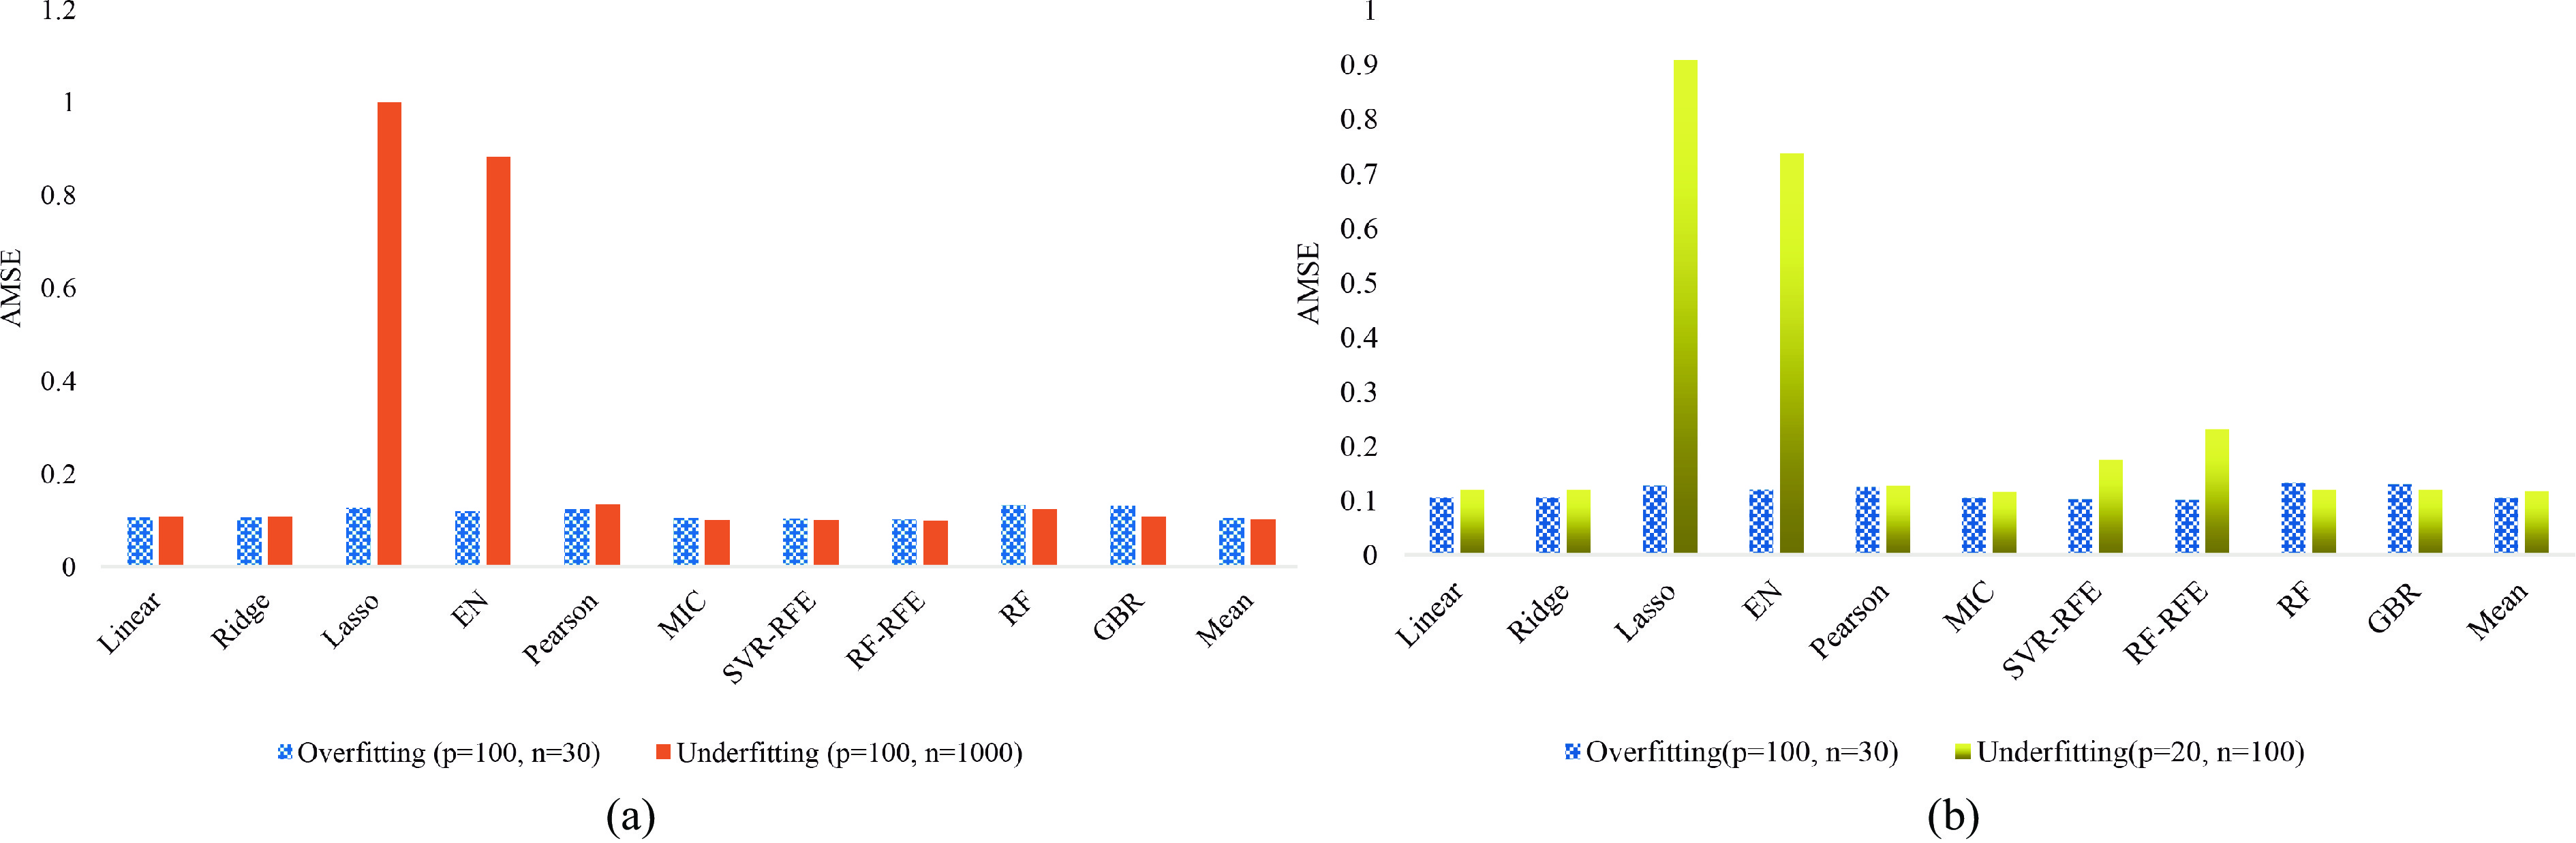
![]() AMSE of methods between the overfitting and underfitting scenarios.
AMSE of methods between the overfitting and underfitting scenarios.
-
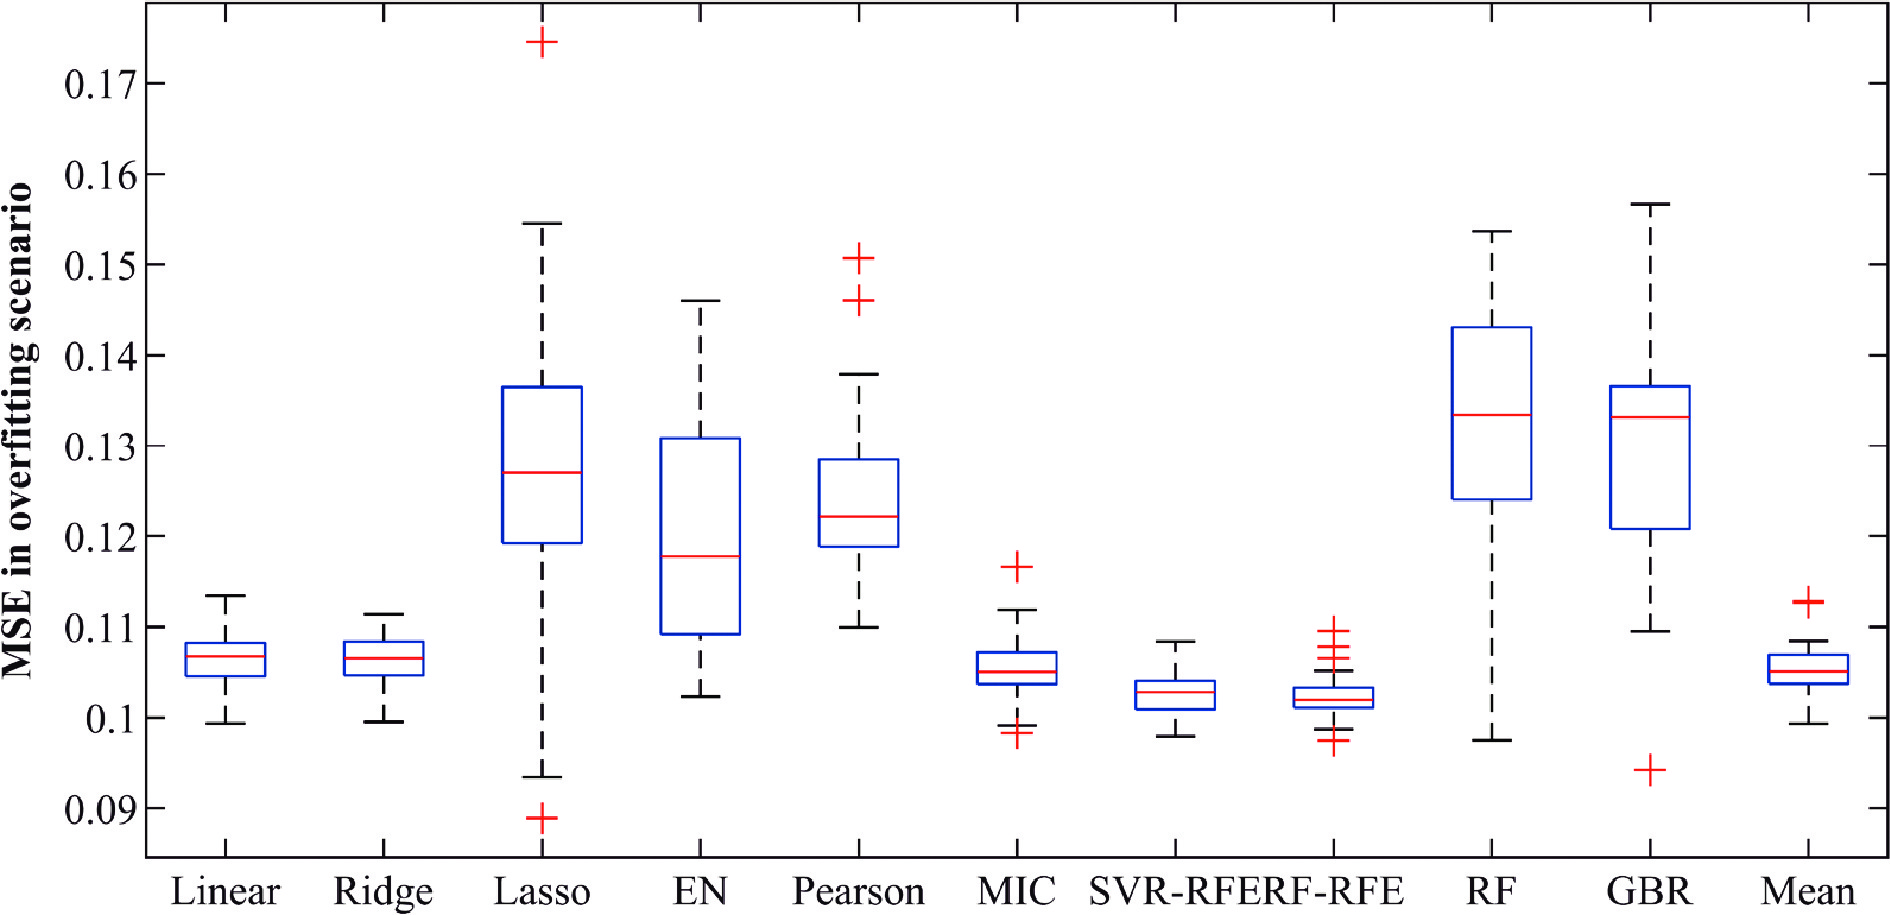
![]() MSE of methods in the overfitting scenario with 30 replications.
MSE of methods in the overfitting scenario with 30 replications.
-
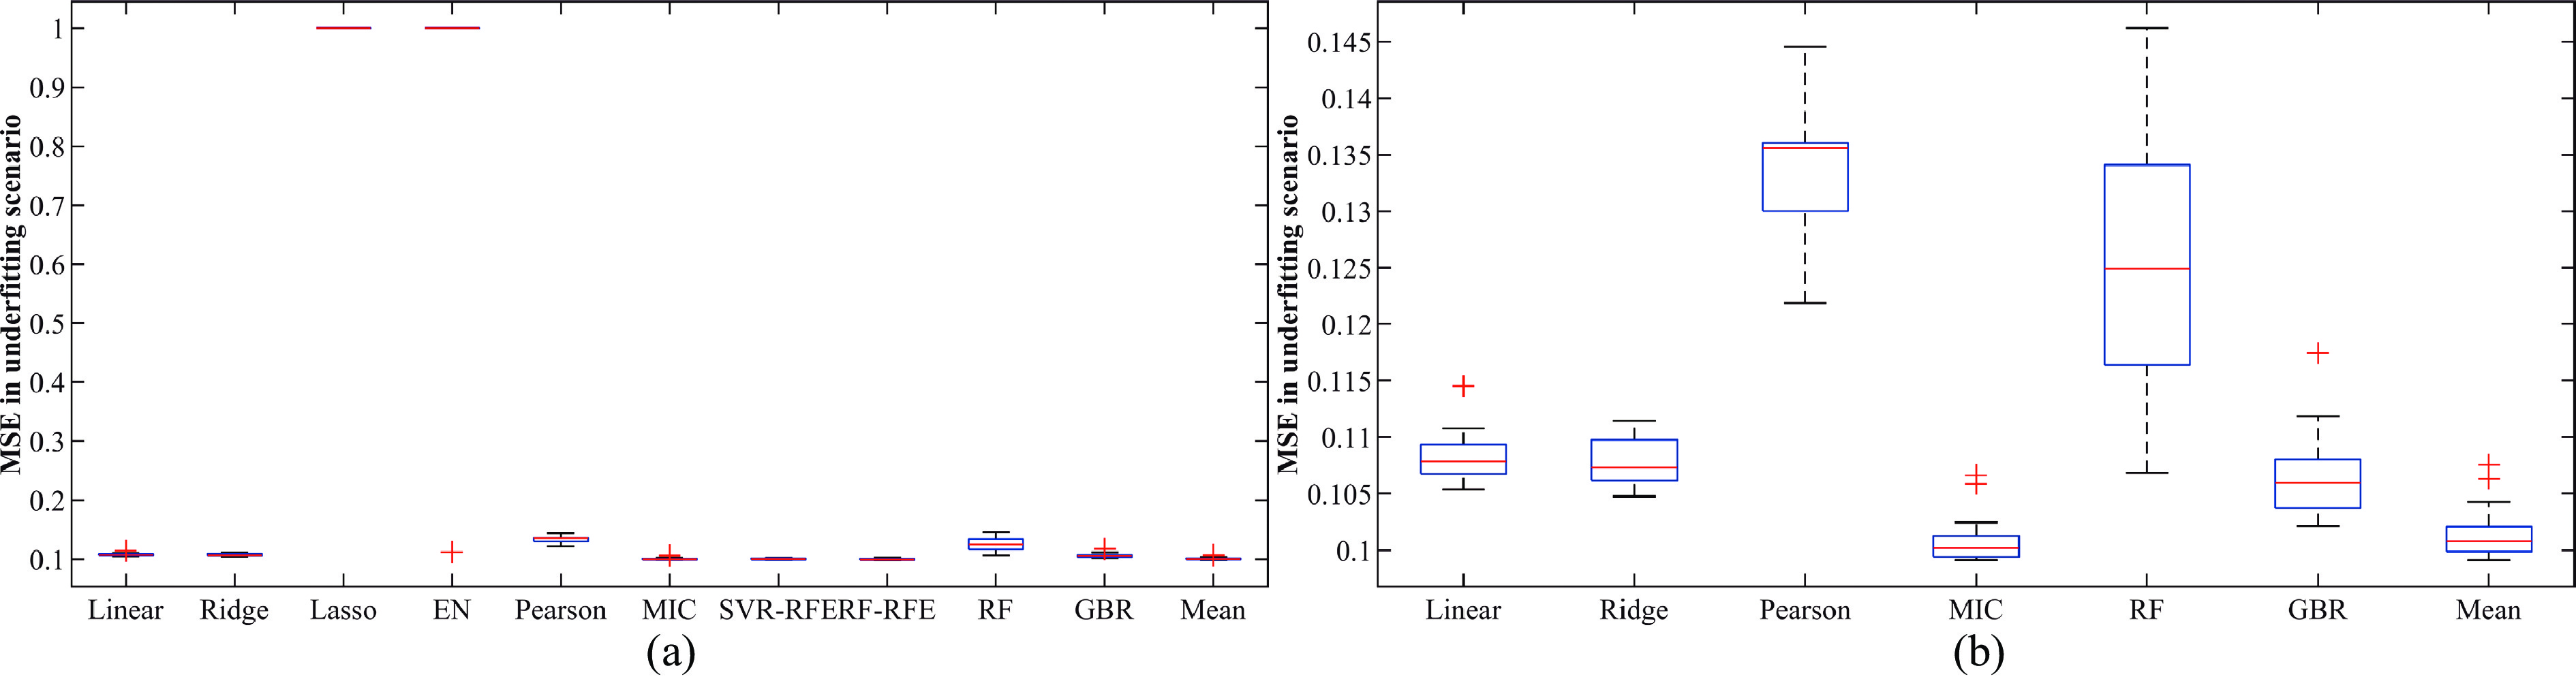
![]() MSE of methods in underfitting scenario I with 30 replications.
MSE of methods in underfitting scenario I with 30 replications.
-
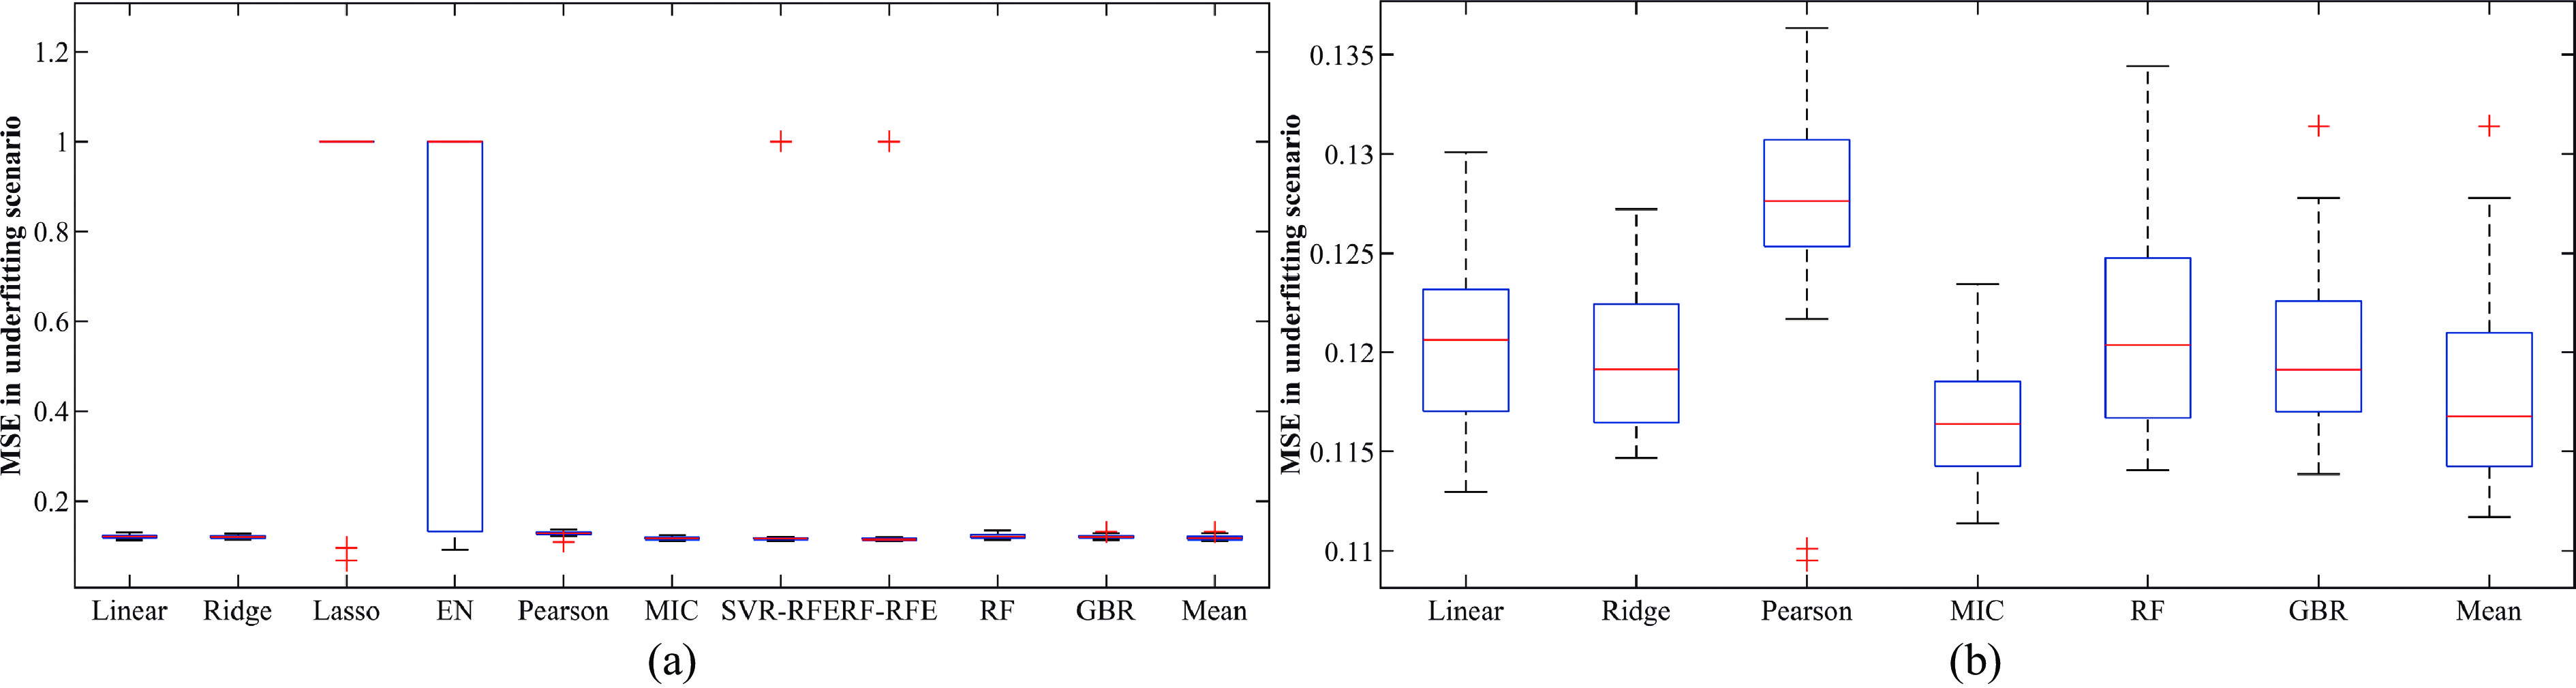
![]() MSE of methods in underfitting scenario II with 30 replications.
MSE of methods in underfitting scenario II with 30 replications.
-
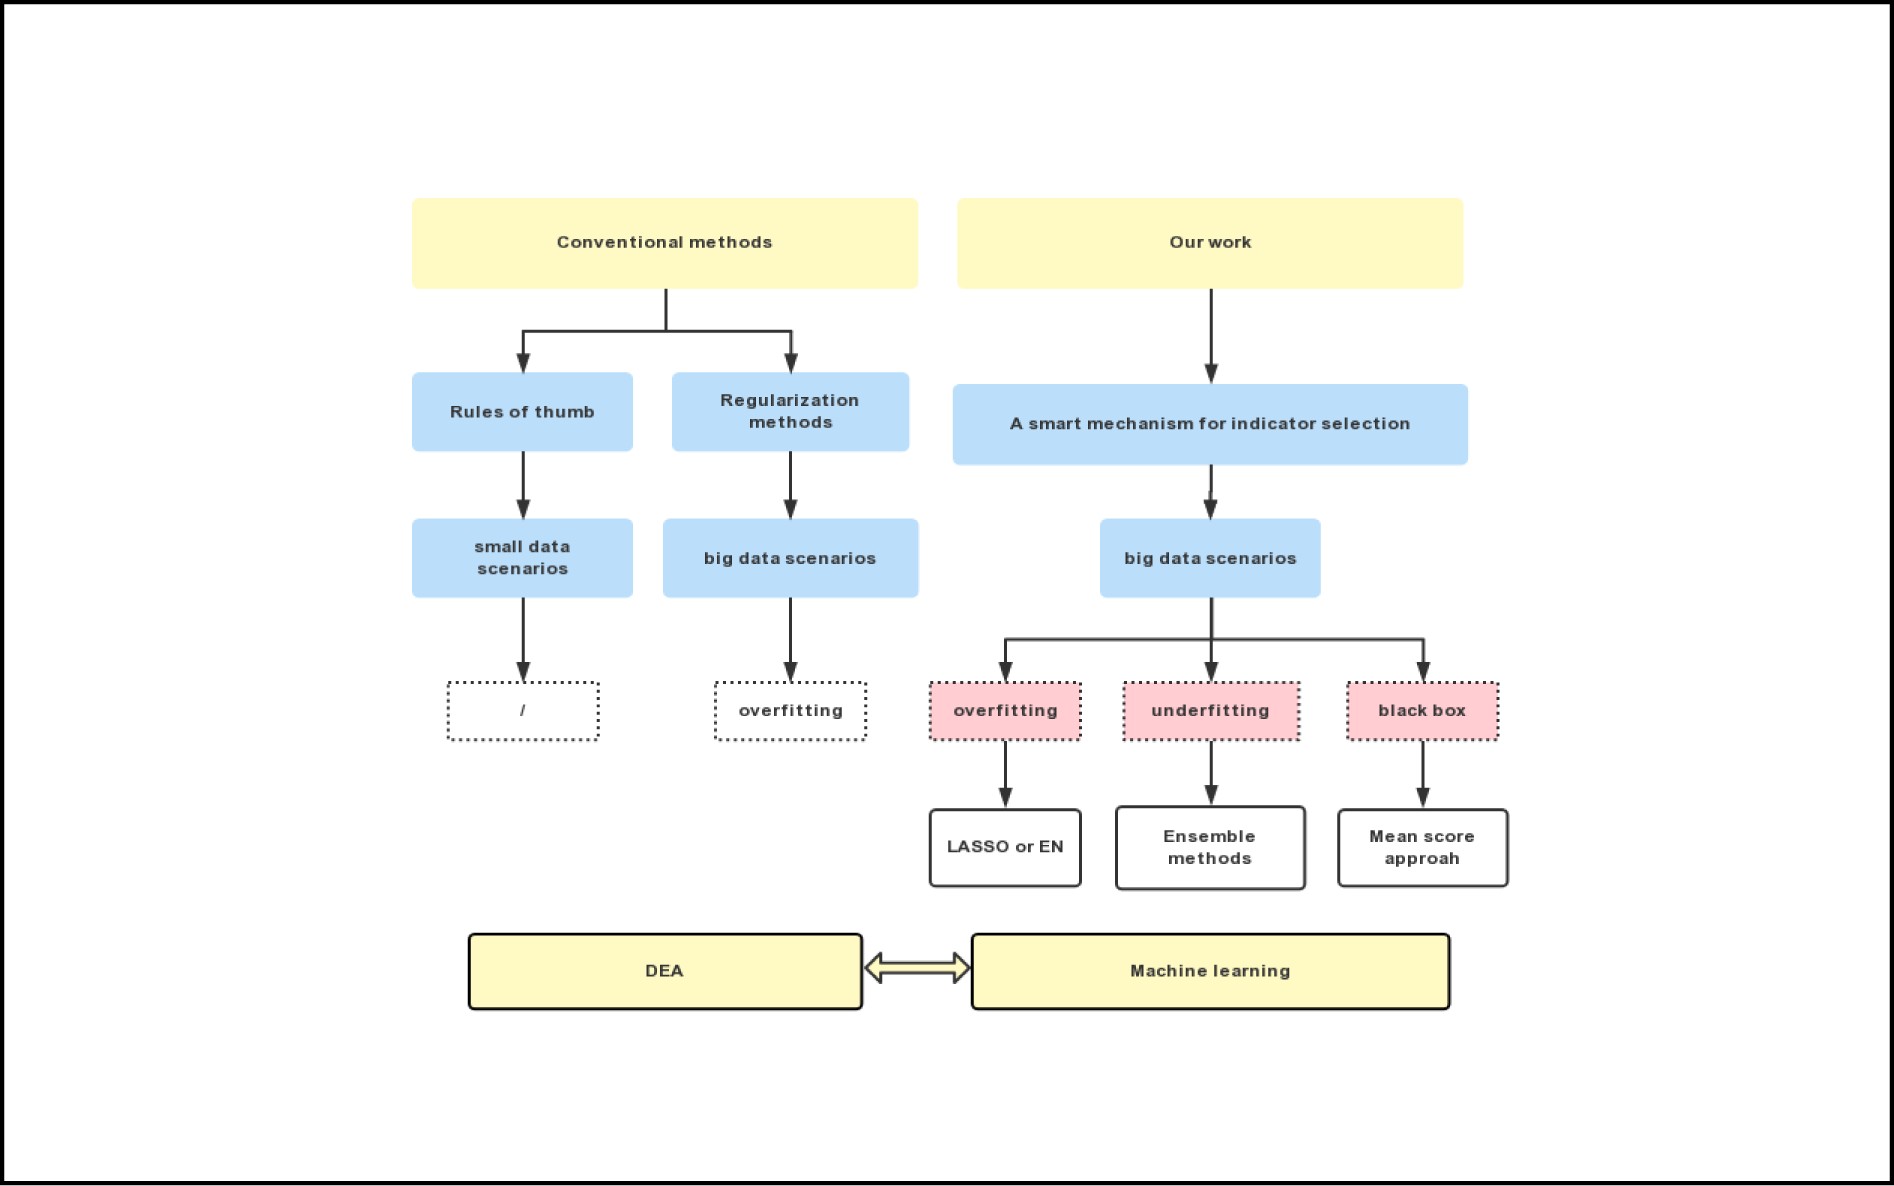
![]() A smart indicator selection mechanism for DEA.
A smart indicator selection mechanism for DEA.
Related articles
-
2024, 54(7): 1-2.
-
2023, 53(12): 1-2.
-
2023, 53(11): 1-2.
-
2023, 53(10): 1-2.
-
2023, 53(9): 1-2.
-
2023, 53(8): 1-2.
-
2023, 53(6): 1-2.
-
2023, 53(5): 1-2.
-
2023, 53(4): 1-2.
-
2022, 52(7): 1-2.
