 Download:
Figures of the Article
-
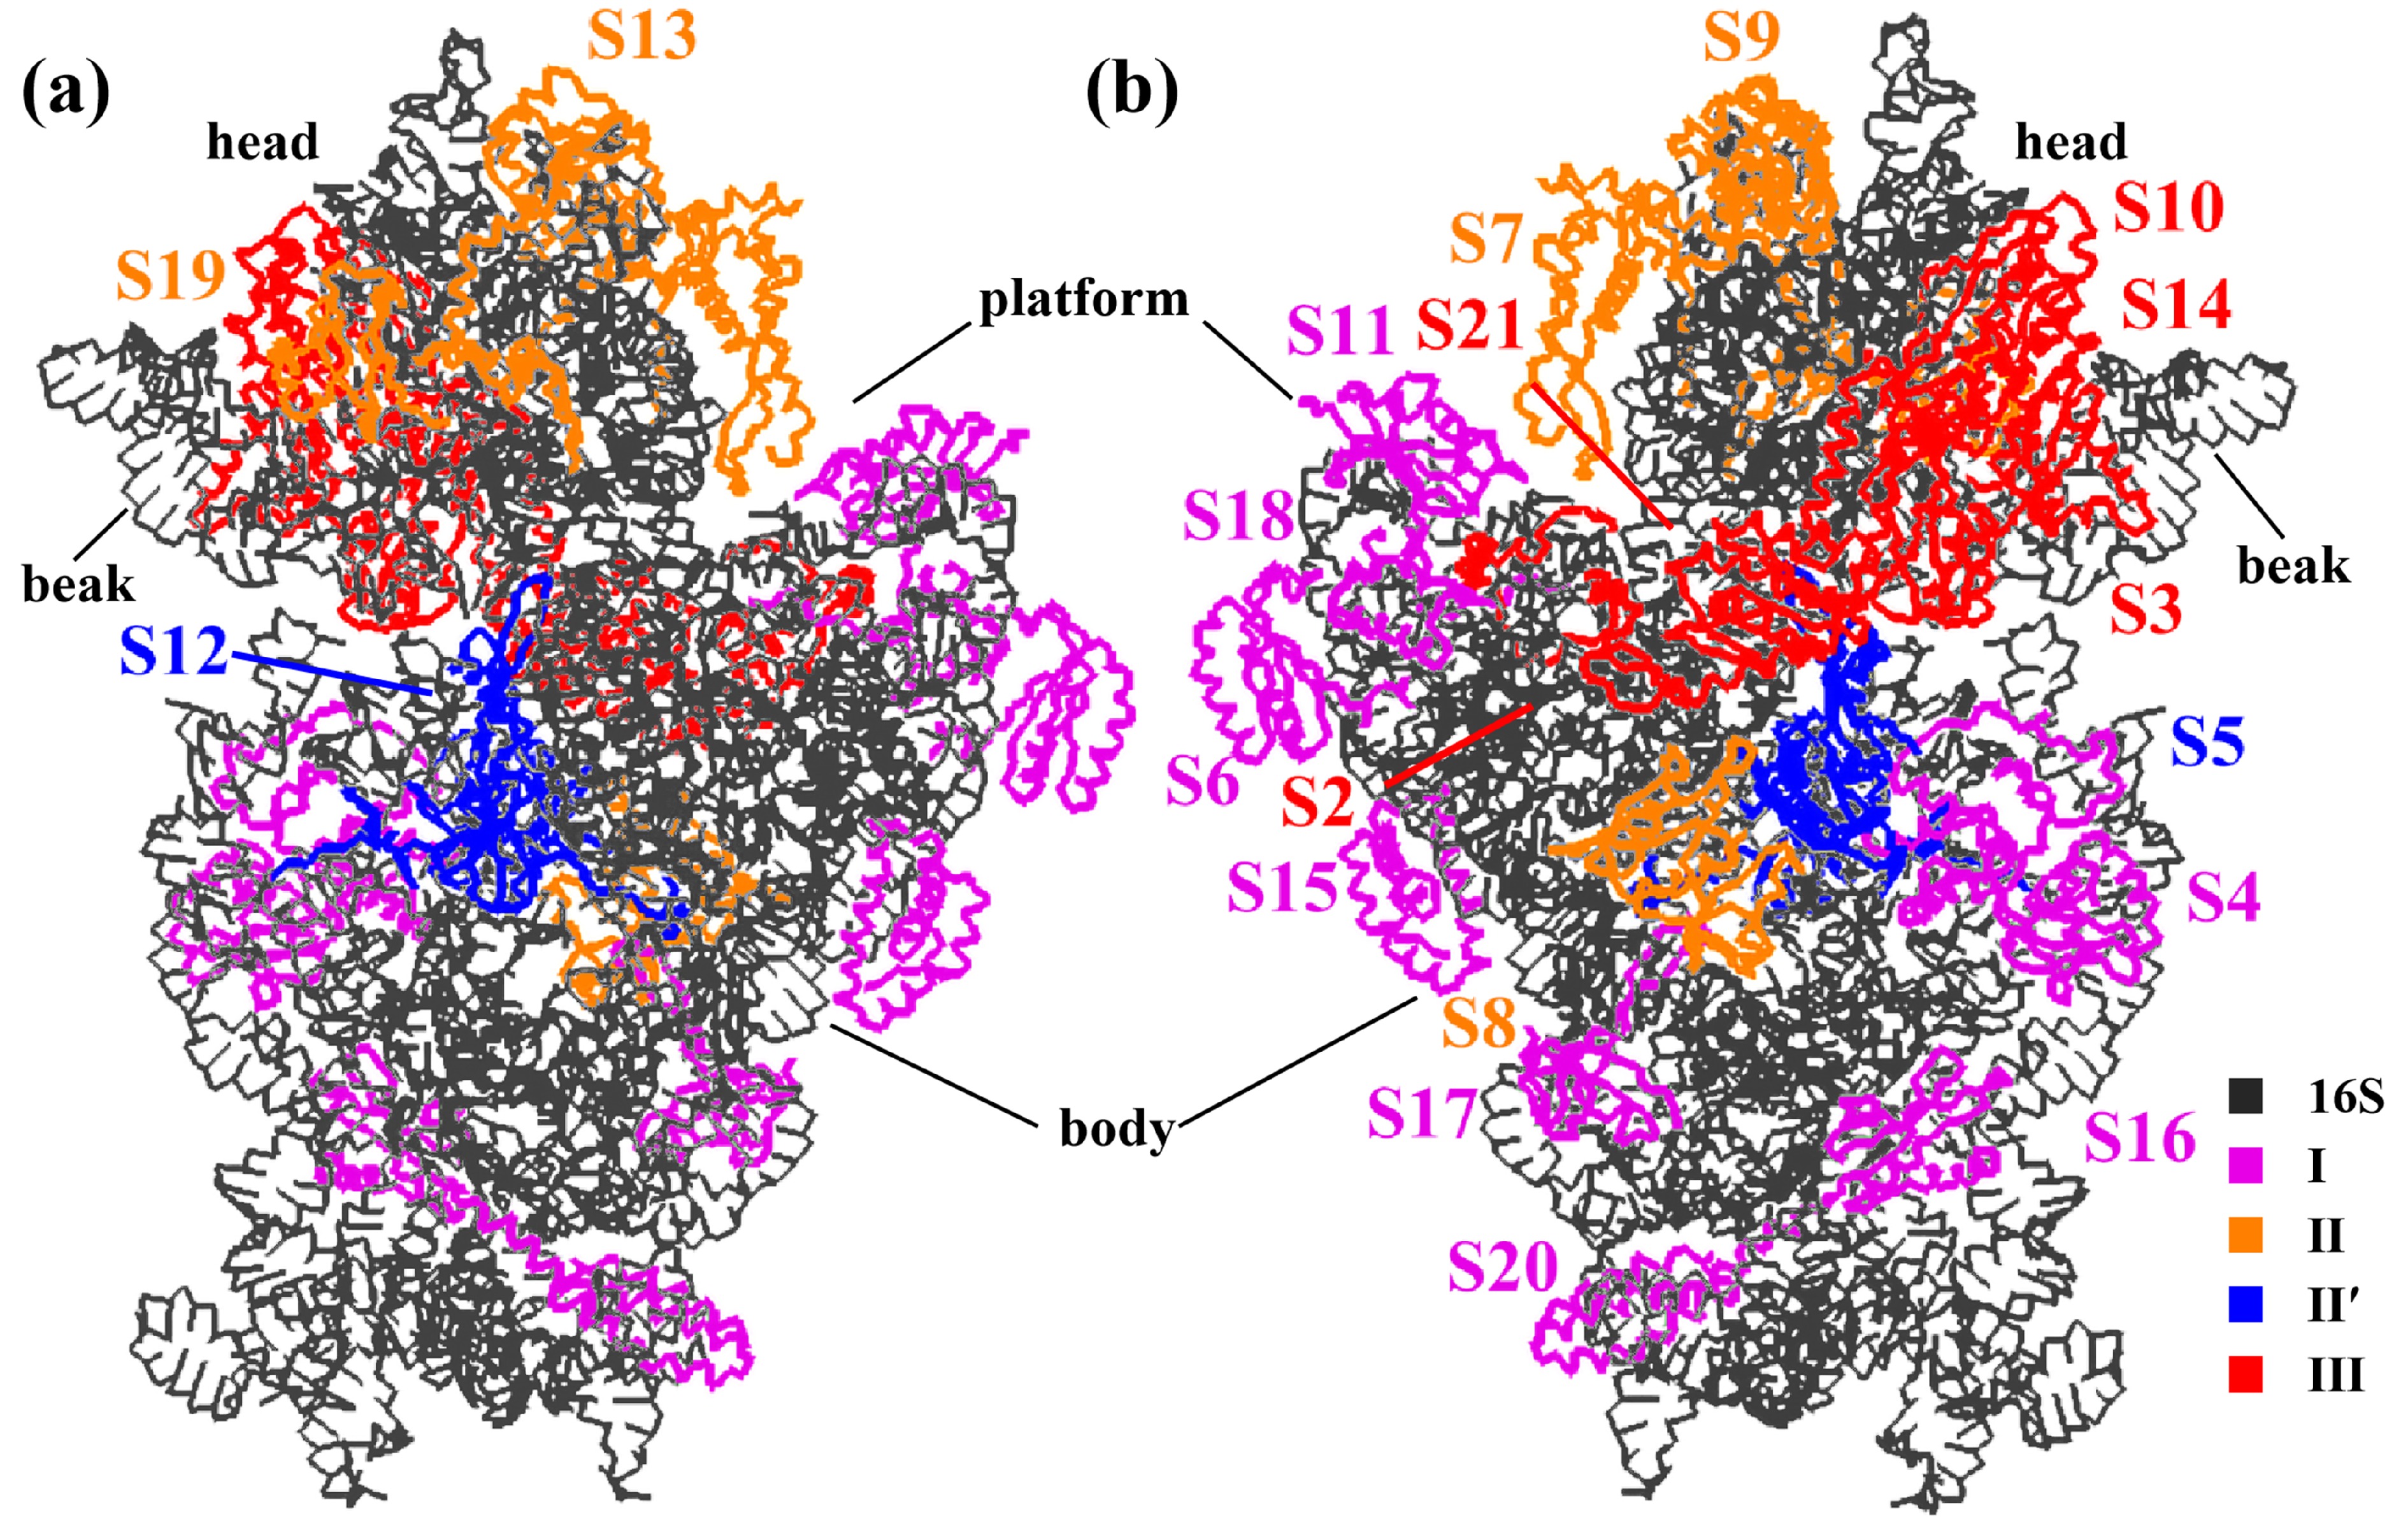
![]() Structure of the 30S ribosomal subunit. (a) The front side (the interface with the 50S subunit) and (b) the back. The 16S rRNA is colored black, and the S proteins are colored differently according to the kinetic assembly map (Table 1). The body, platform, head, and beak are labeled.
Structure of the 30S ribosomal subunit. (a) The front side (the interface with the 50S subunit) and (b) the back. The 16S rRNA is colored black, and the S proteins are colored differently according to the kinetic assembly map (Table 1). The body, platform, head, and beak are labeled.
-
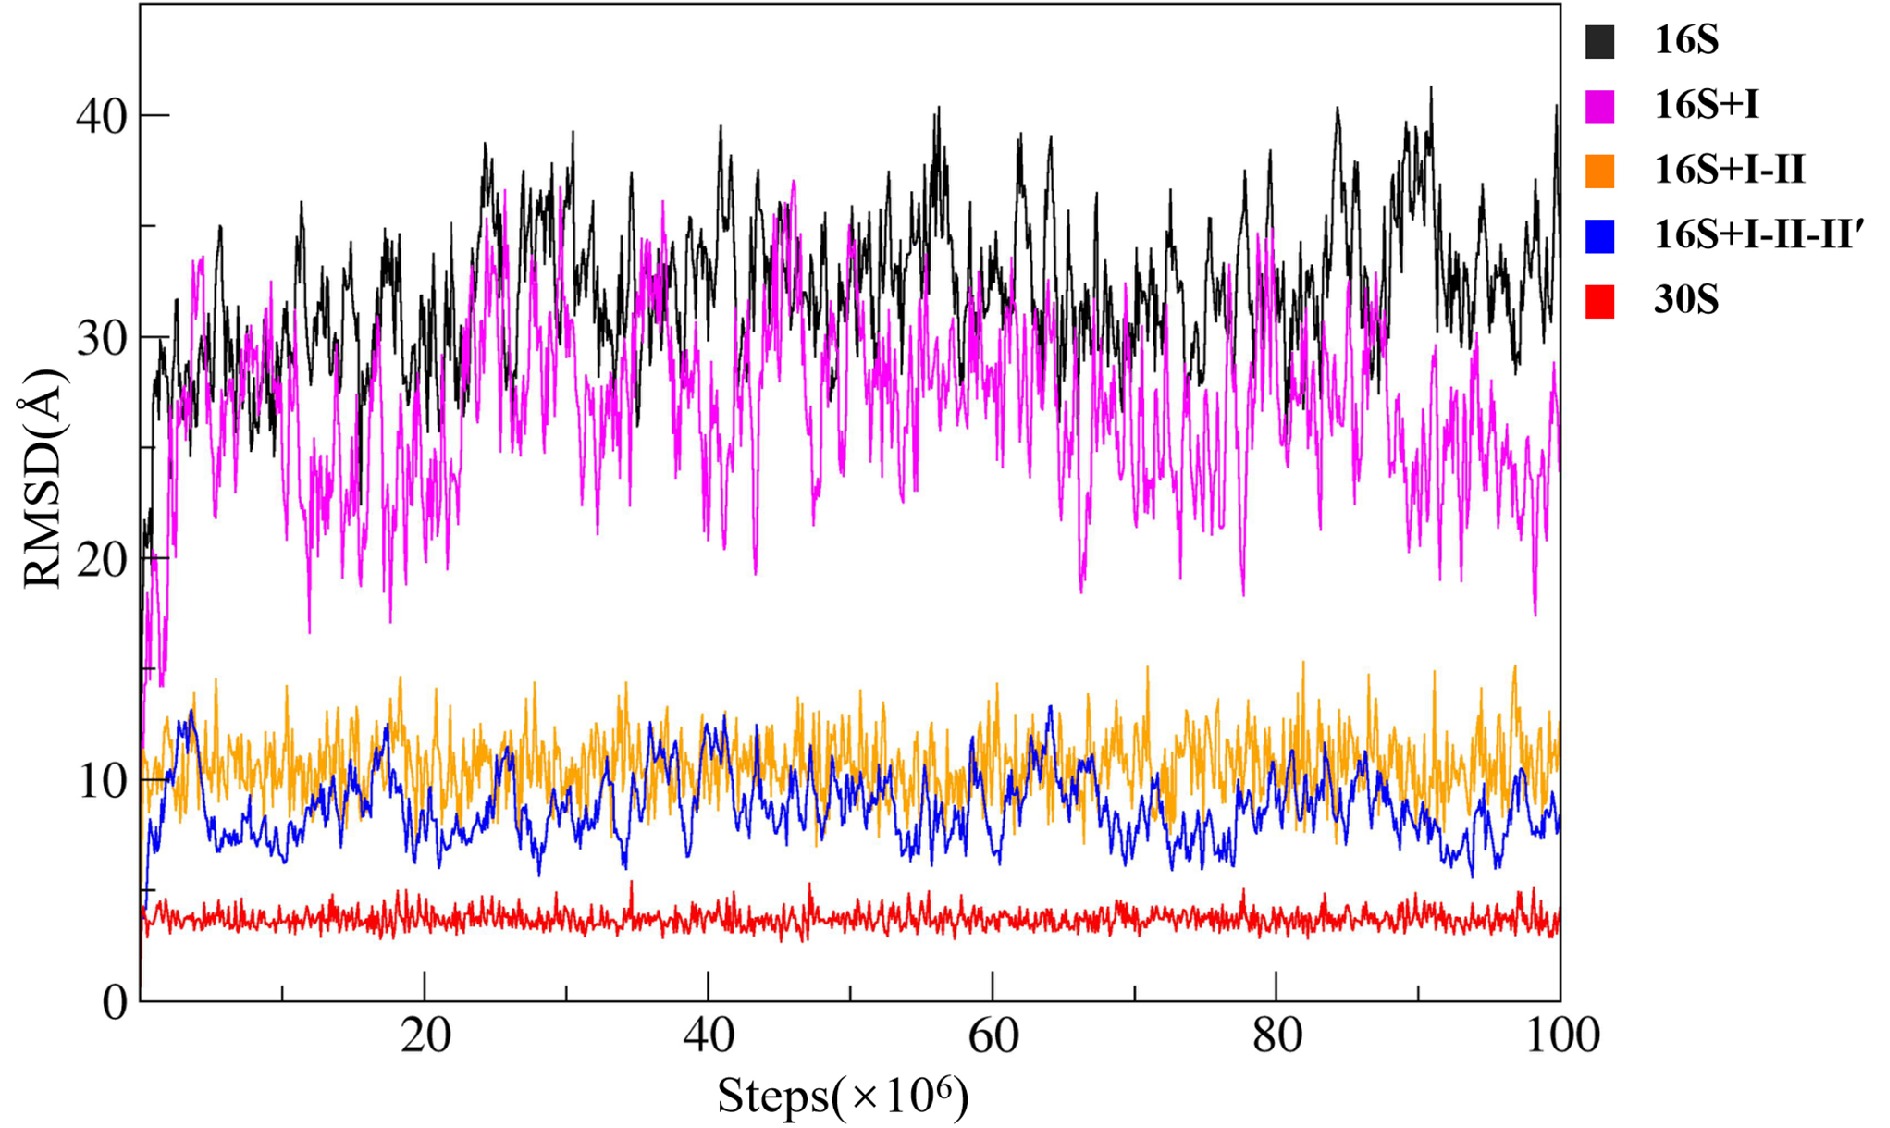
![]() Time evolution of RMSD during the CG simulations. Black: the naked 16S rRNA, magenta: the 16S rRNA with the early-assembly proteins, orange: the 16S rRNA with the early- and mid-assembly proteins, blue: the 16S rRNA with early-, mid-, and mid-late-assembly proteins, and red: the 30S subunit.
Time evolution of RMSD during the CG simulations. Black: the naked 16S rRNA, magenta: the 16S rRNA with the early-assembly proteins, orange: the 16S rRNA with the early- and mid-assembly proteins, blue: the 16S rRNA with early-, mid-, and mid-late-assembly proteins, and red: the 30S subunit.
-
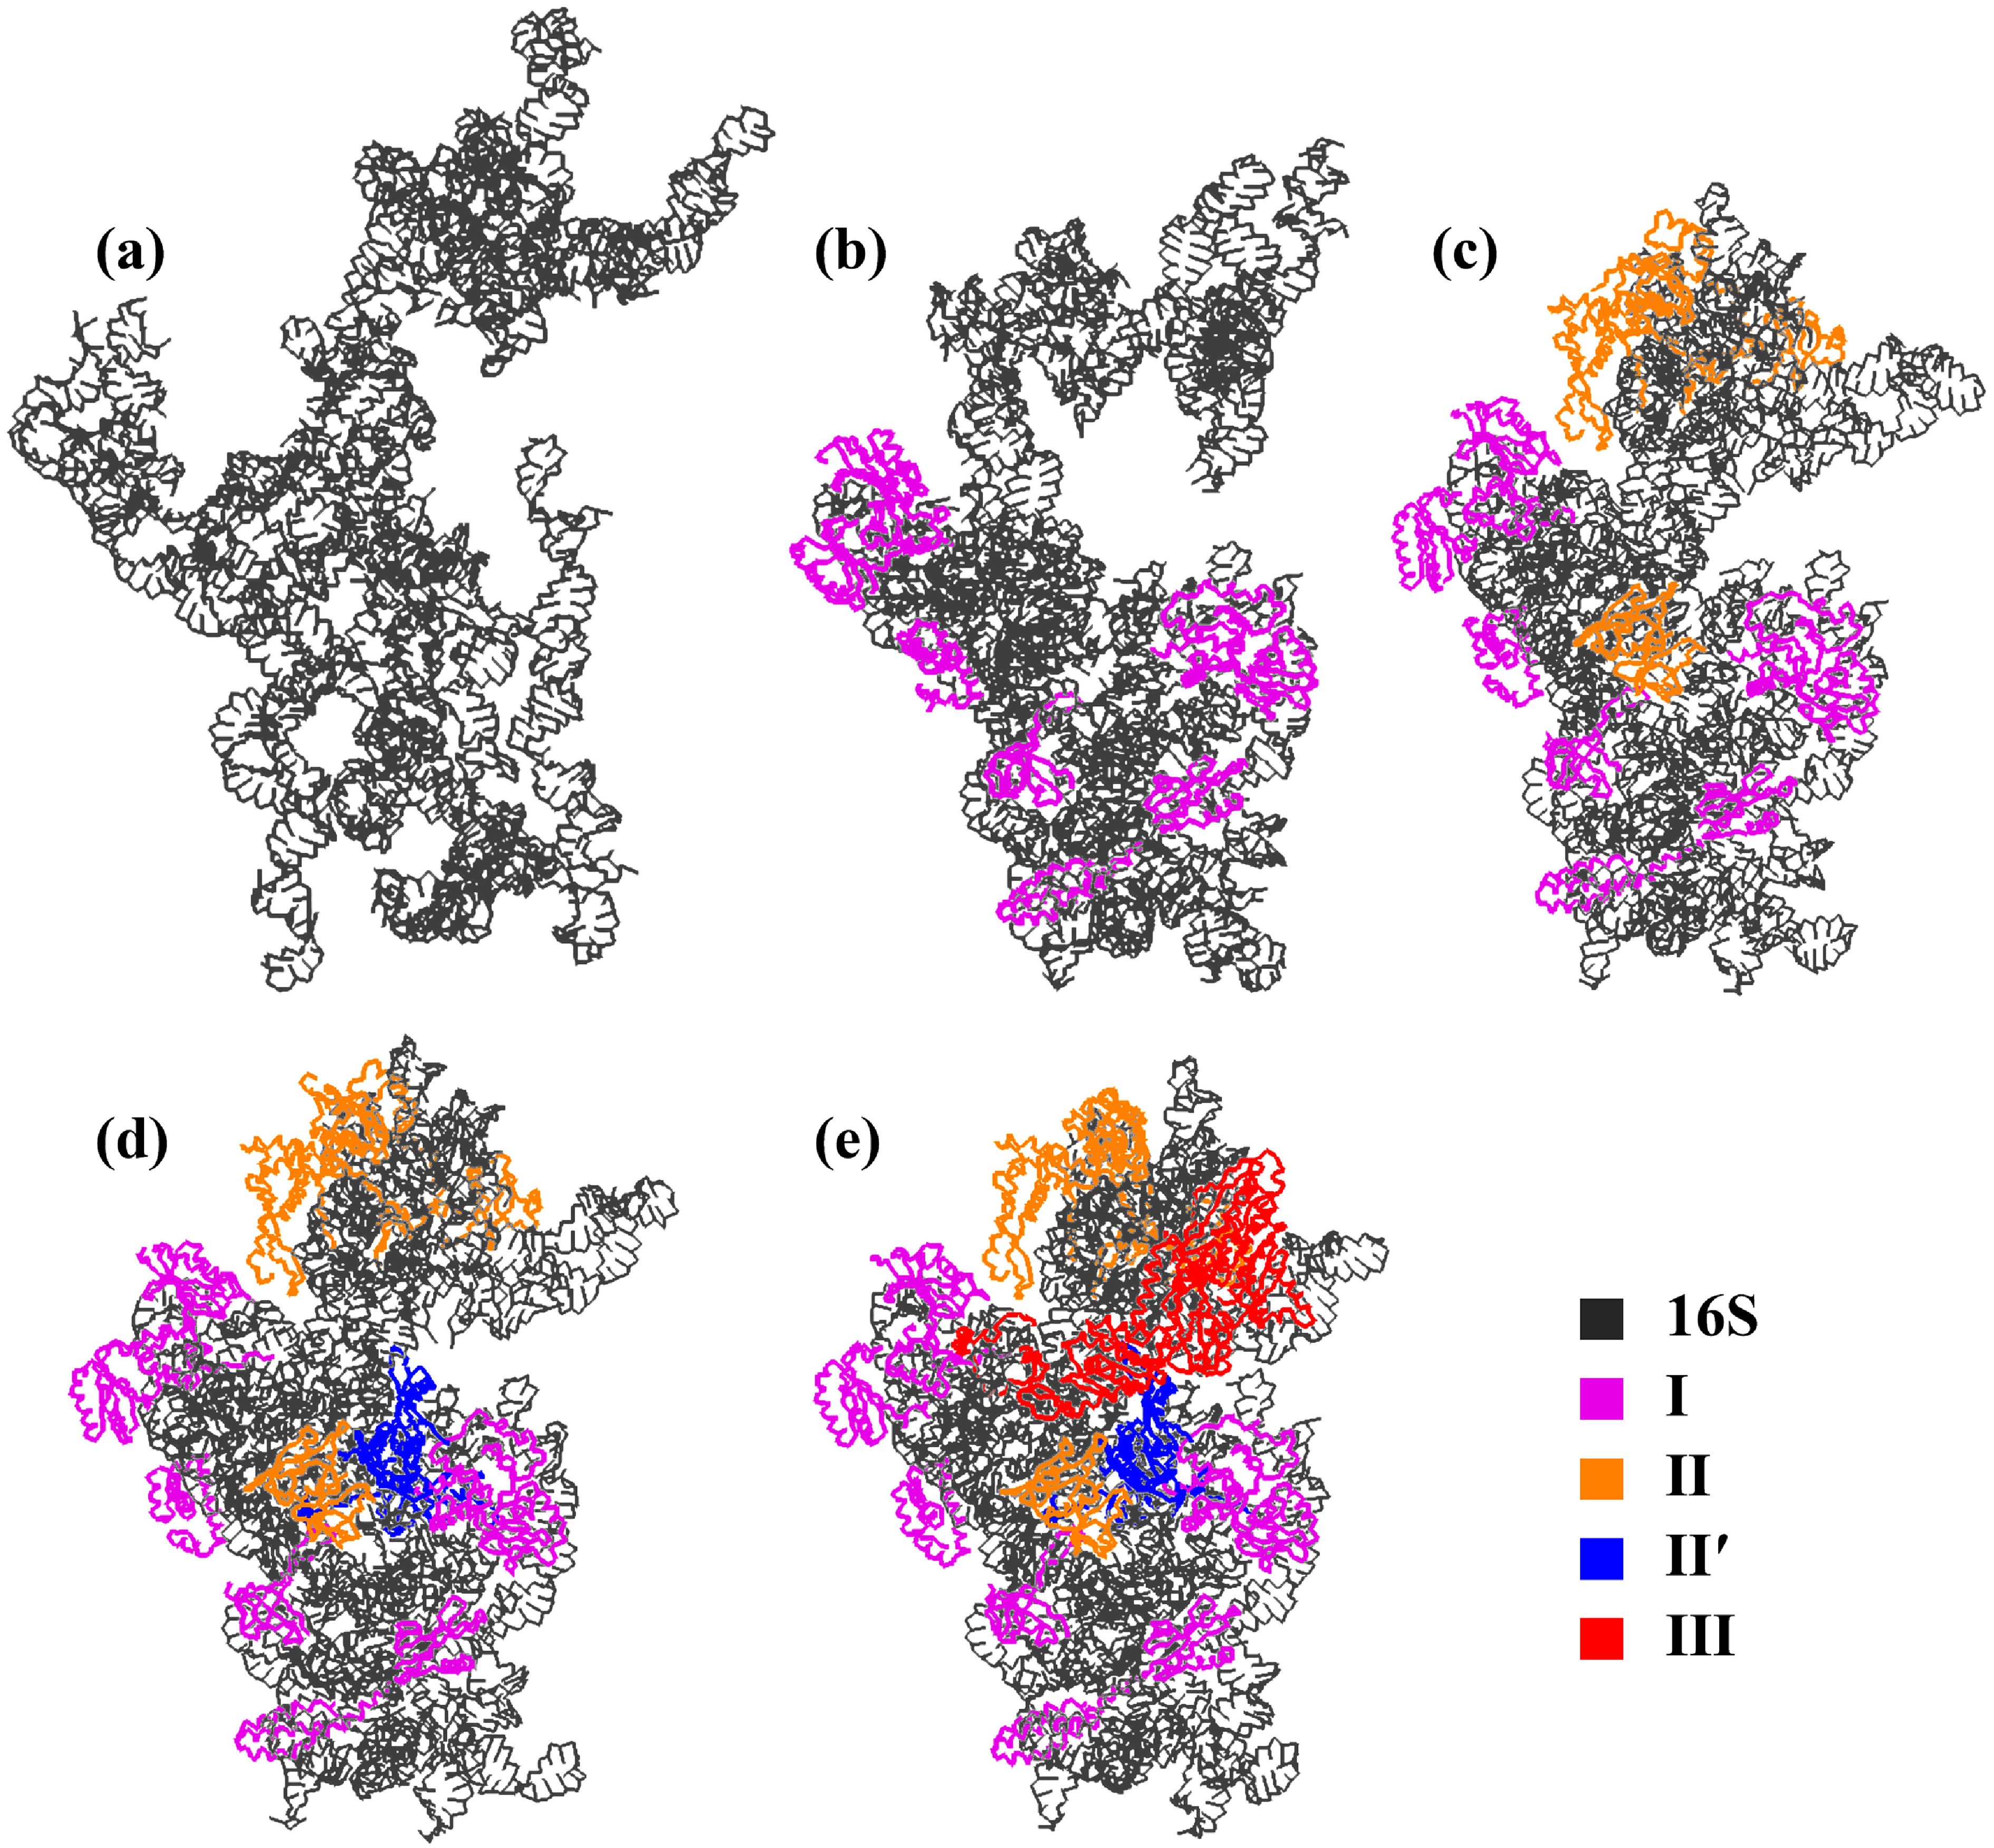
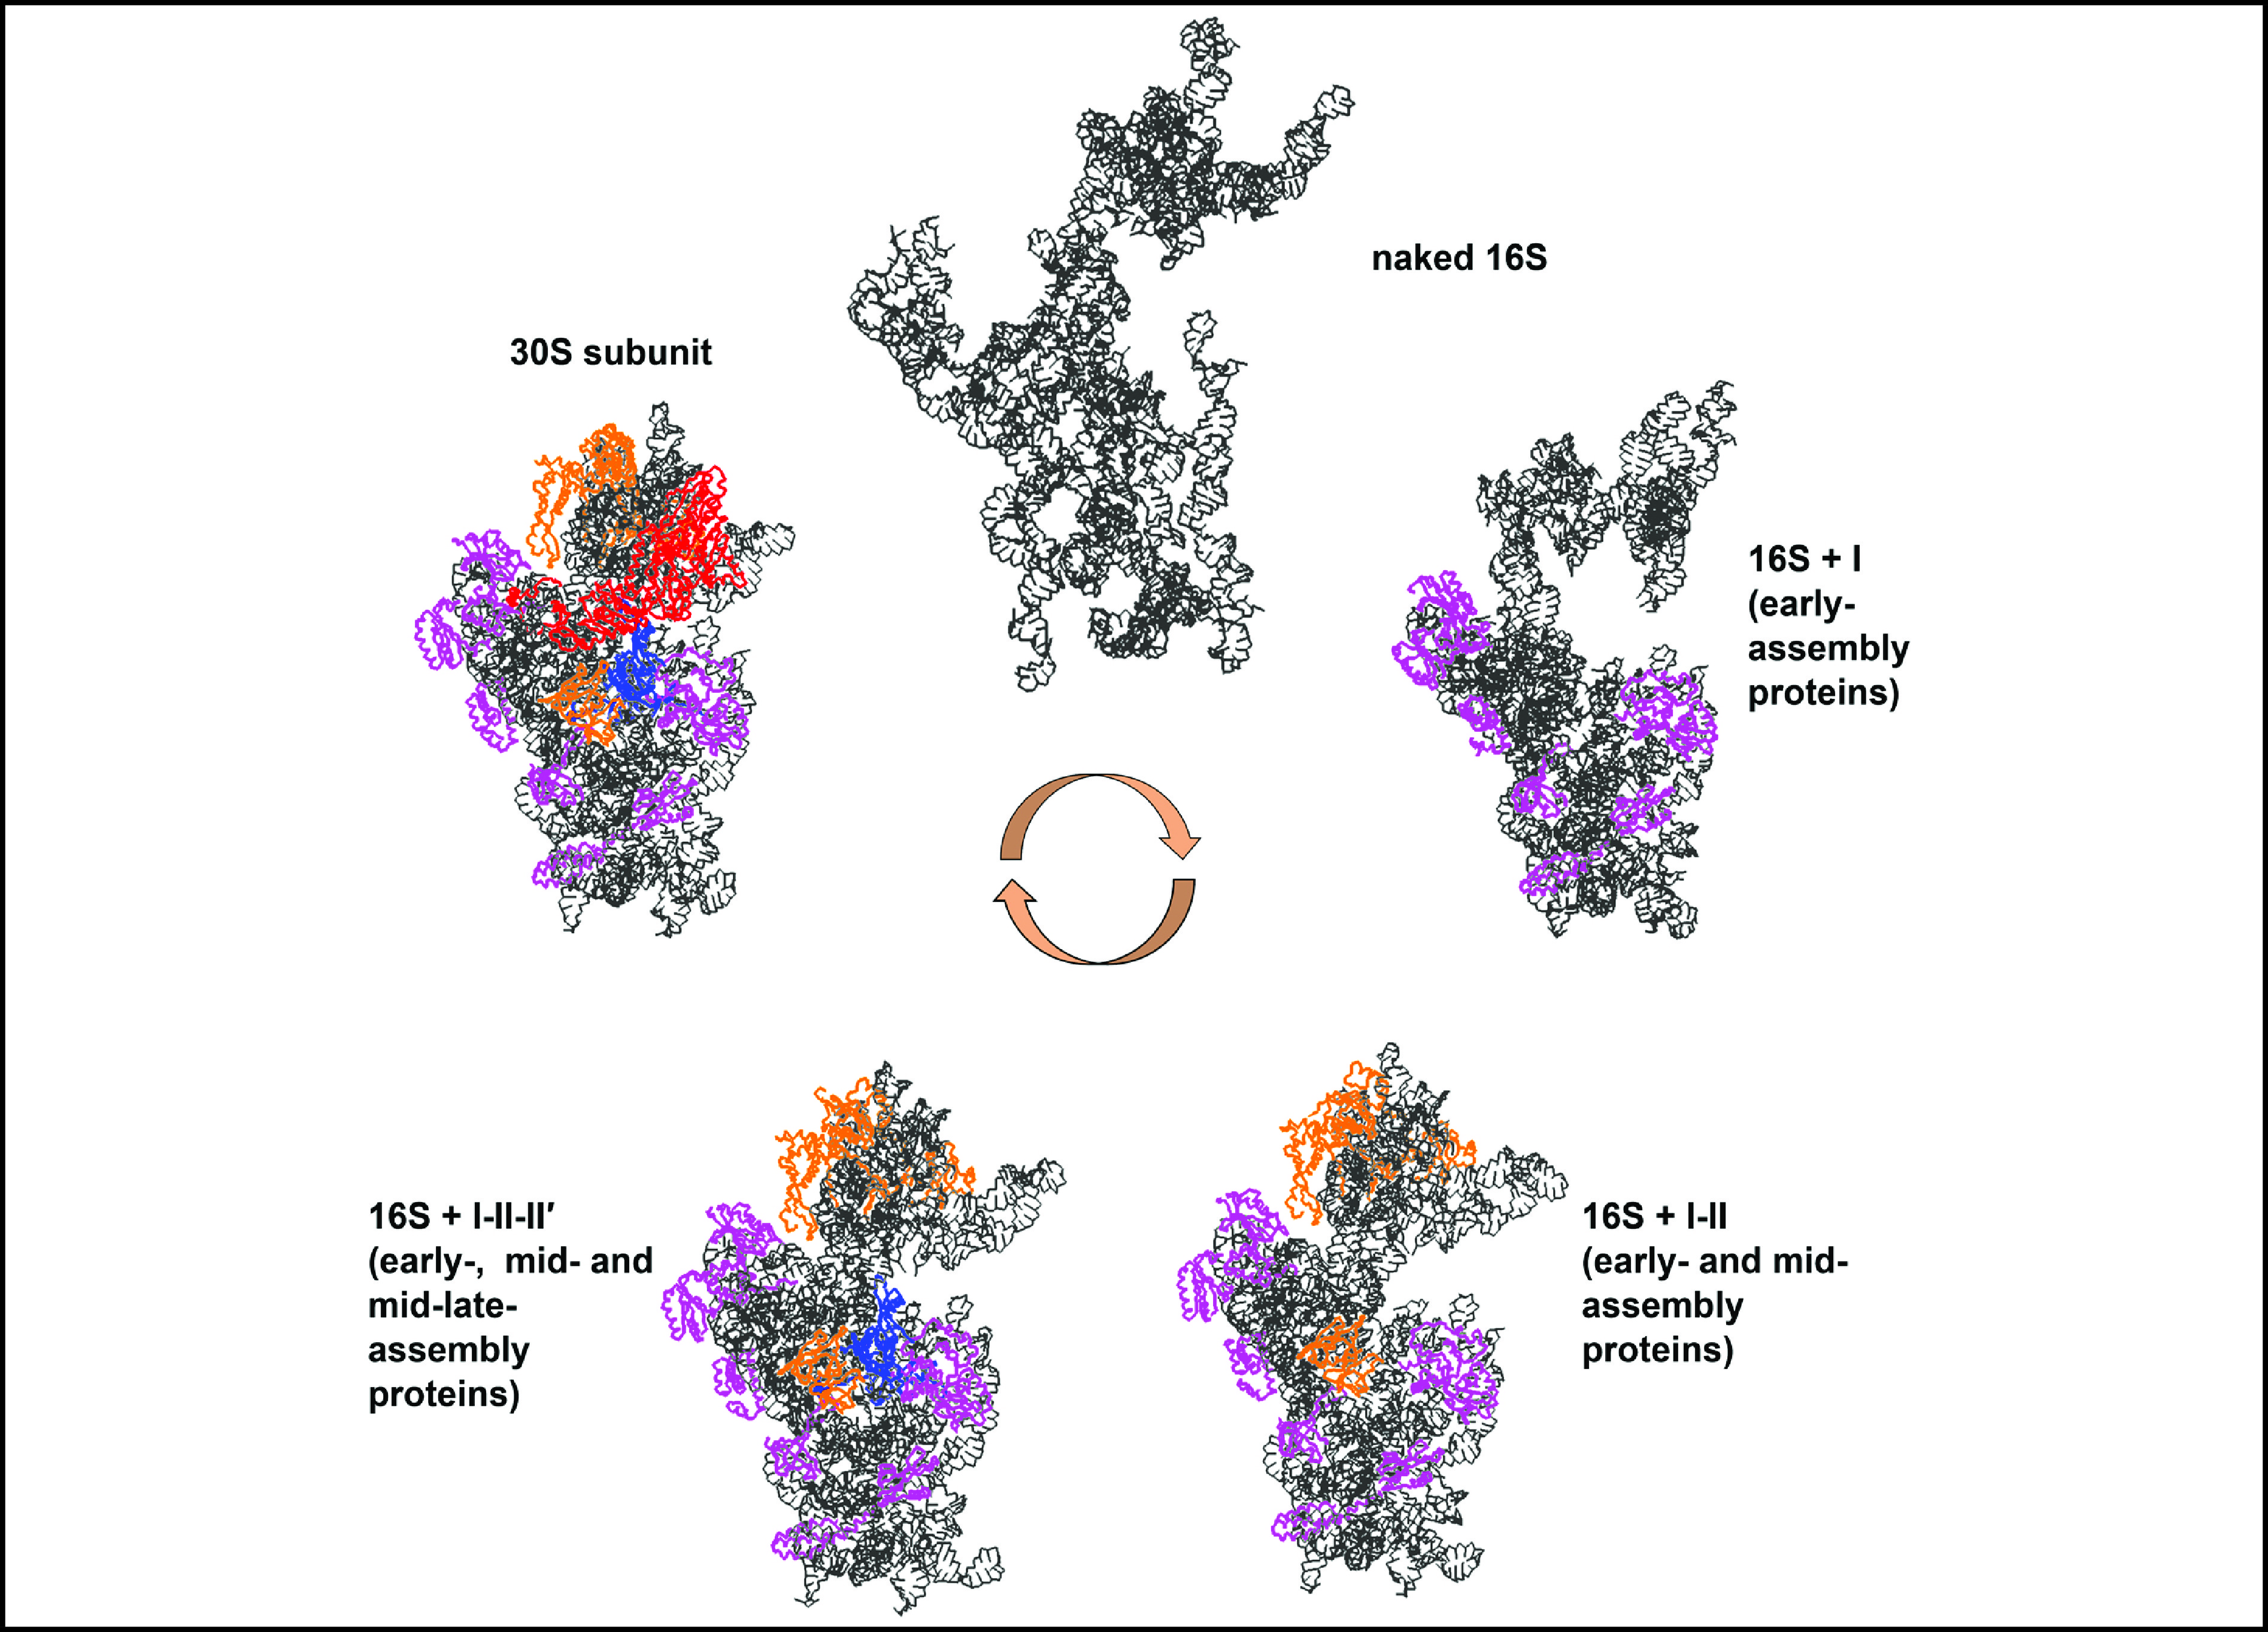
![]() Stability of the 16S rRNA after assembling the S proteins at each stage sequentially. (a) Naked 16S rRNA. (b) The 16S rRNA with only the early-assembly proteins. (c) The 16S rRNA with the early- and mid-assembly proteins. (d) The 16S rRNA with the early-, mid- and mid-late-assembly proteins. (e) The 30S subunit. At each stage, the final structure of the CG simulation is shown.
Stability of the 16S rRNA after assembling the S proteins at each stage sequentially. (a) Naked 16S rRNA. (b) The 16S rRNA with only the early-assembly proteins. (c) The 16S rRNA with the early- and mid-assembly proteins. (d) The 16S rRNA with the early-, mid- and mid-late-assembly proteins. (e) The 30S subunit. At each stage, the final structure of the CG simulation is shown.
-
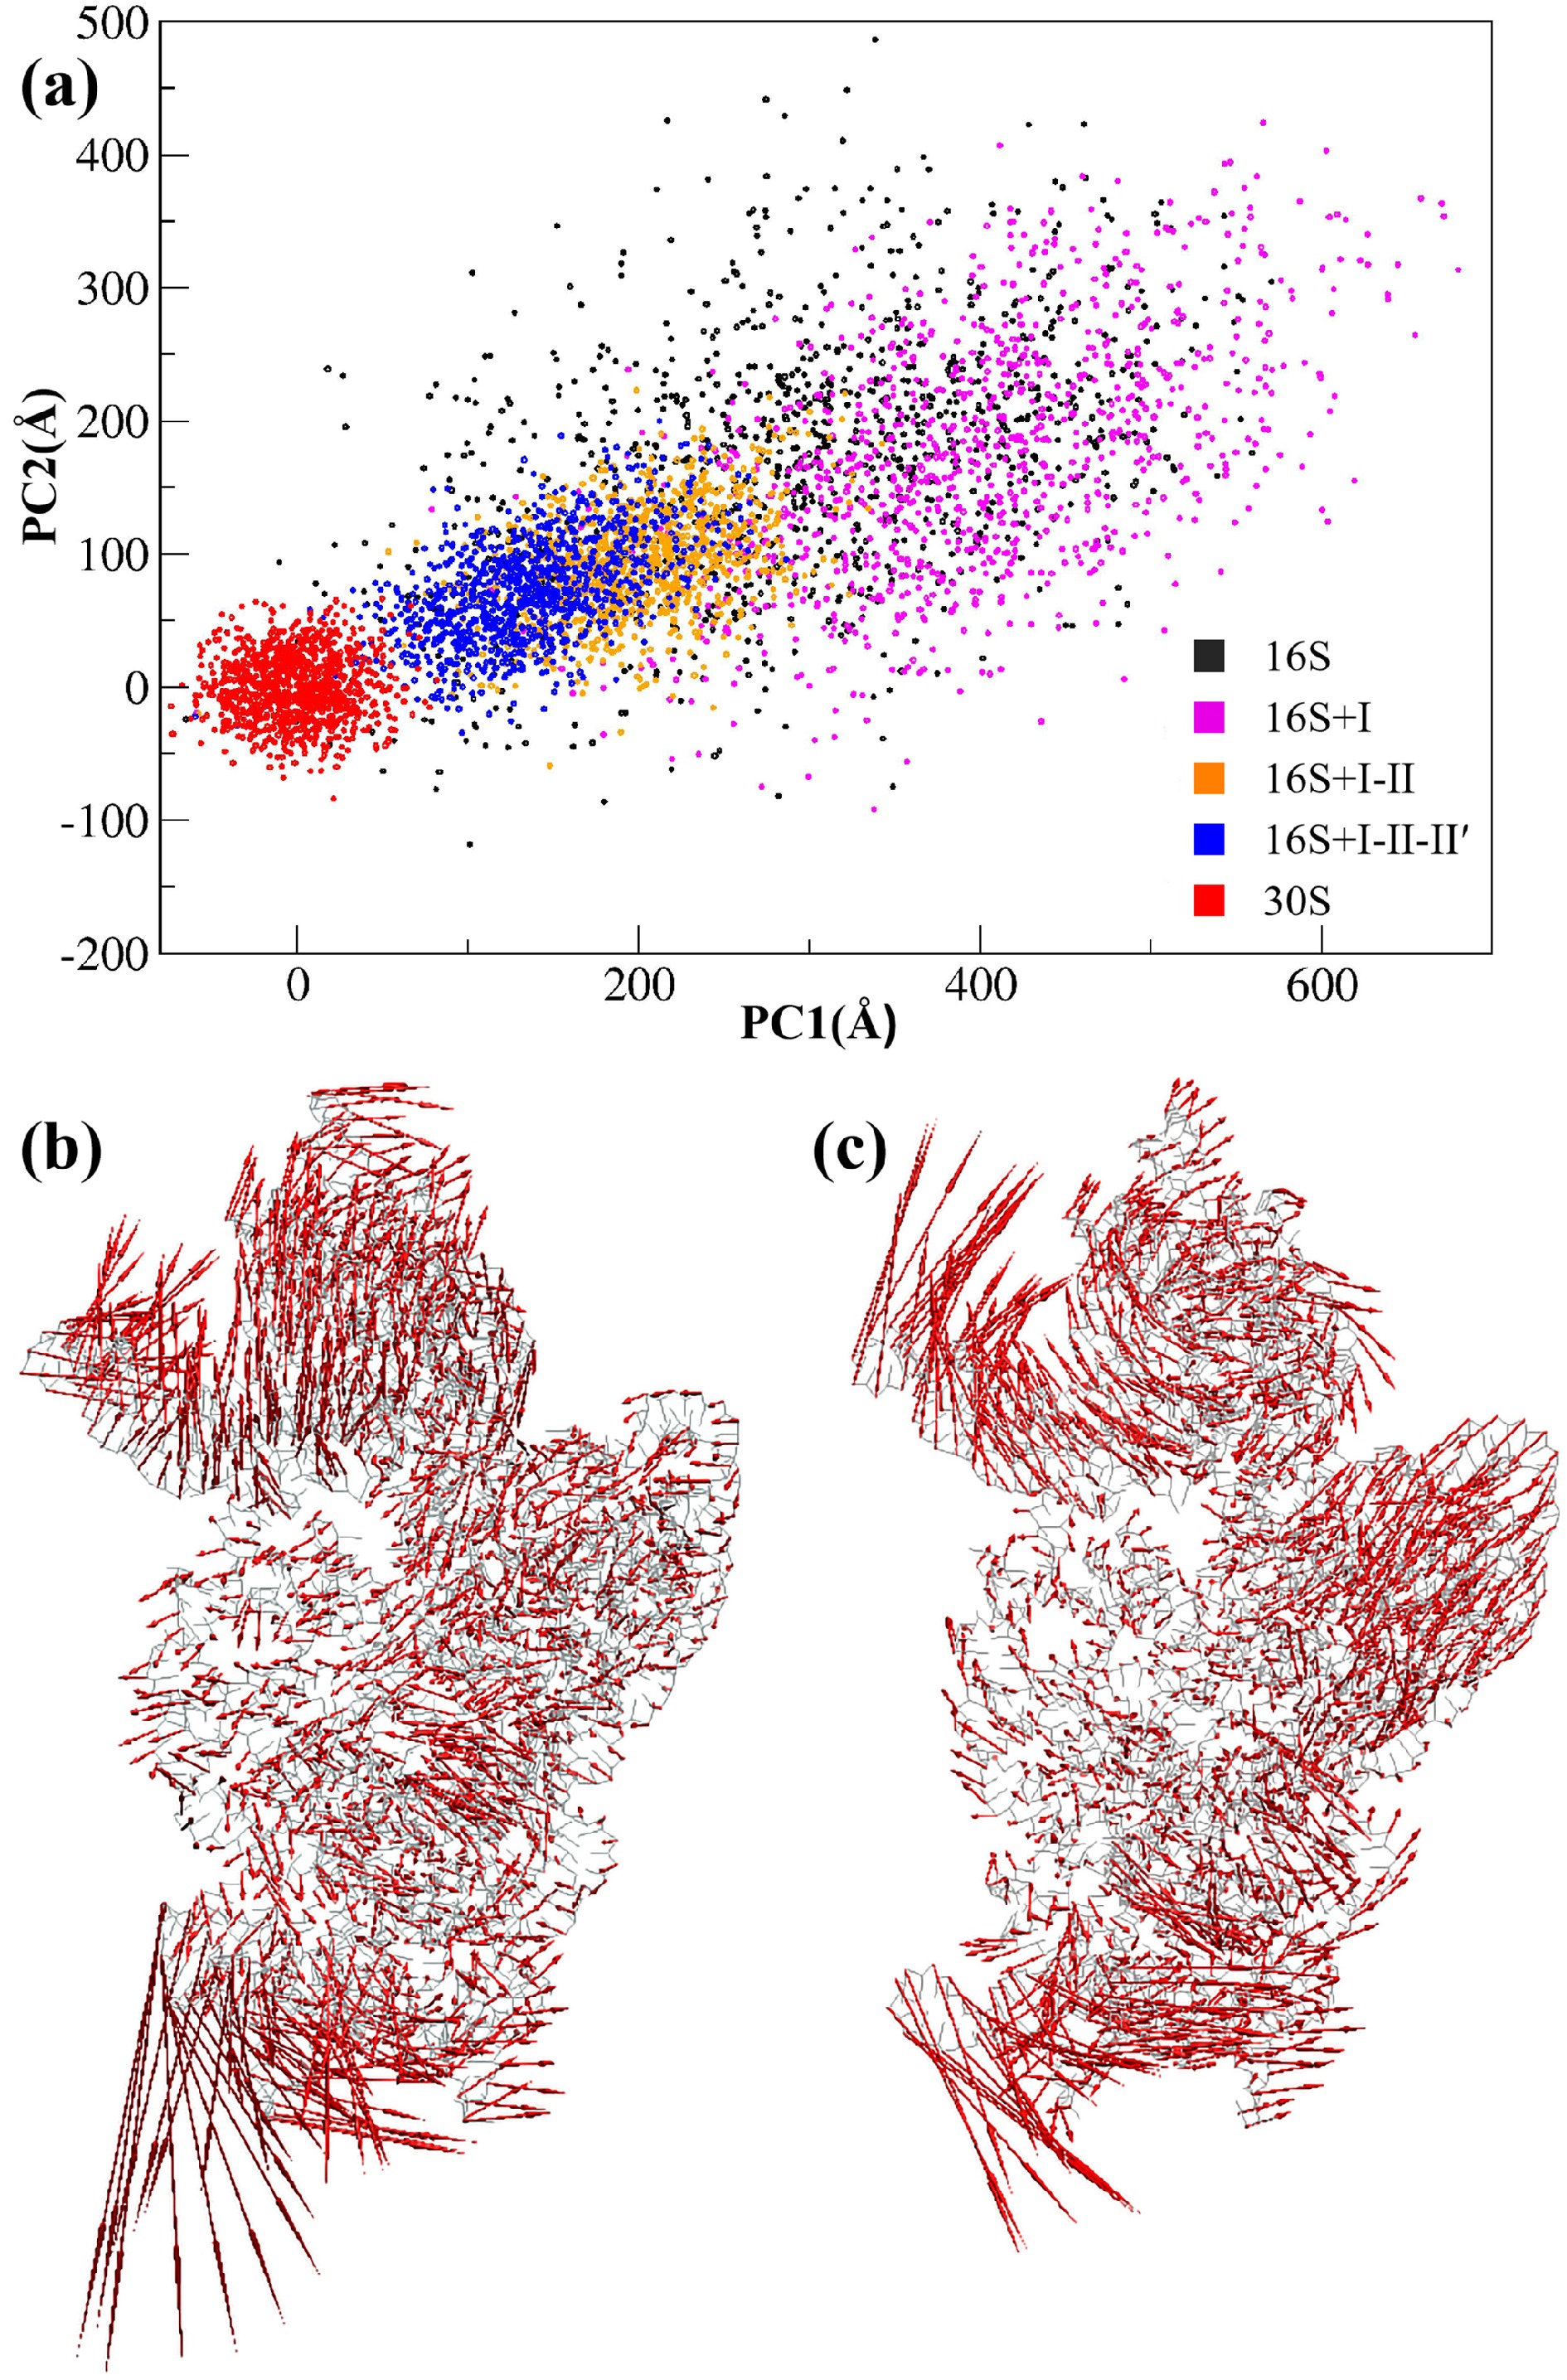
![]() An assembly path of the 30S subunit shown on a subspace defined by the PCA modes. PCA was conducted on the CG trajectory of the 30S subunit, and only P particles were used to construct the covariance matrix. The first two PCA modes with the largest eigenvalues (PC1 and PC2) were chosen to define the 2D subspace. (a) Projections of the different CG trajectories onto the subspace. (b) Collective motion along PC1. (c) Collective motion along PC2.
An assembly path of the 30S subunit shown on a subspace defined by the PCA modes. PCA was conducted on the CG trajectory of the 30S subunit, and only P particles were used to construct the covariance matrix. The first two PCA modes with the largest eigenvalues (PC1 and PC2) were chosen to define the 2D subspace. (a) Projections of the different CG trajectories onto the subspace. (b) Collective motion along PC1. (c) Collective motion along PC2.
-
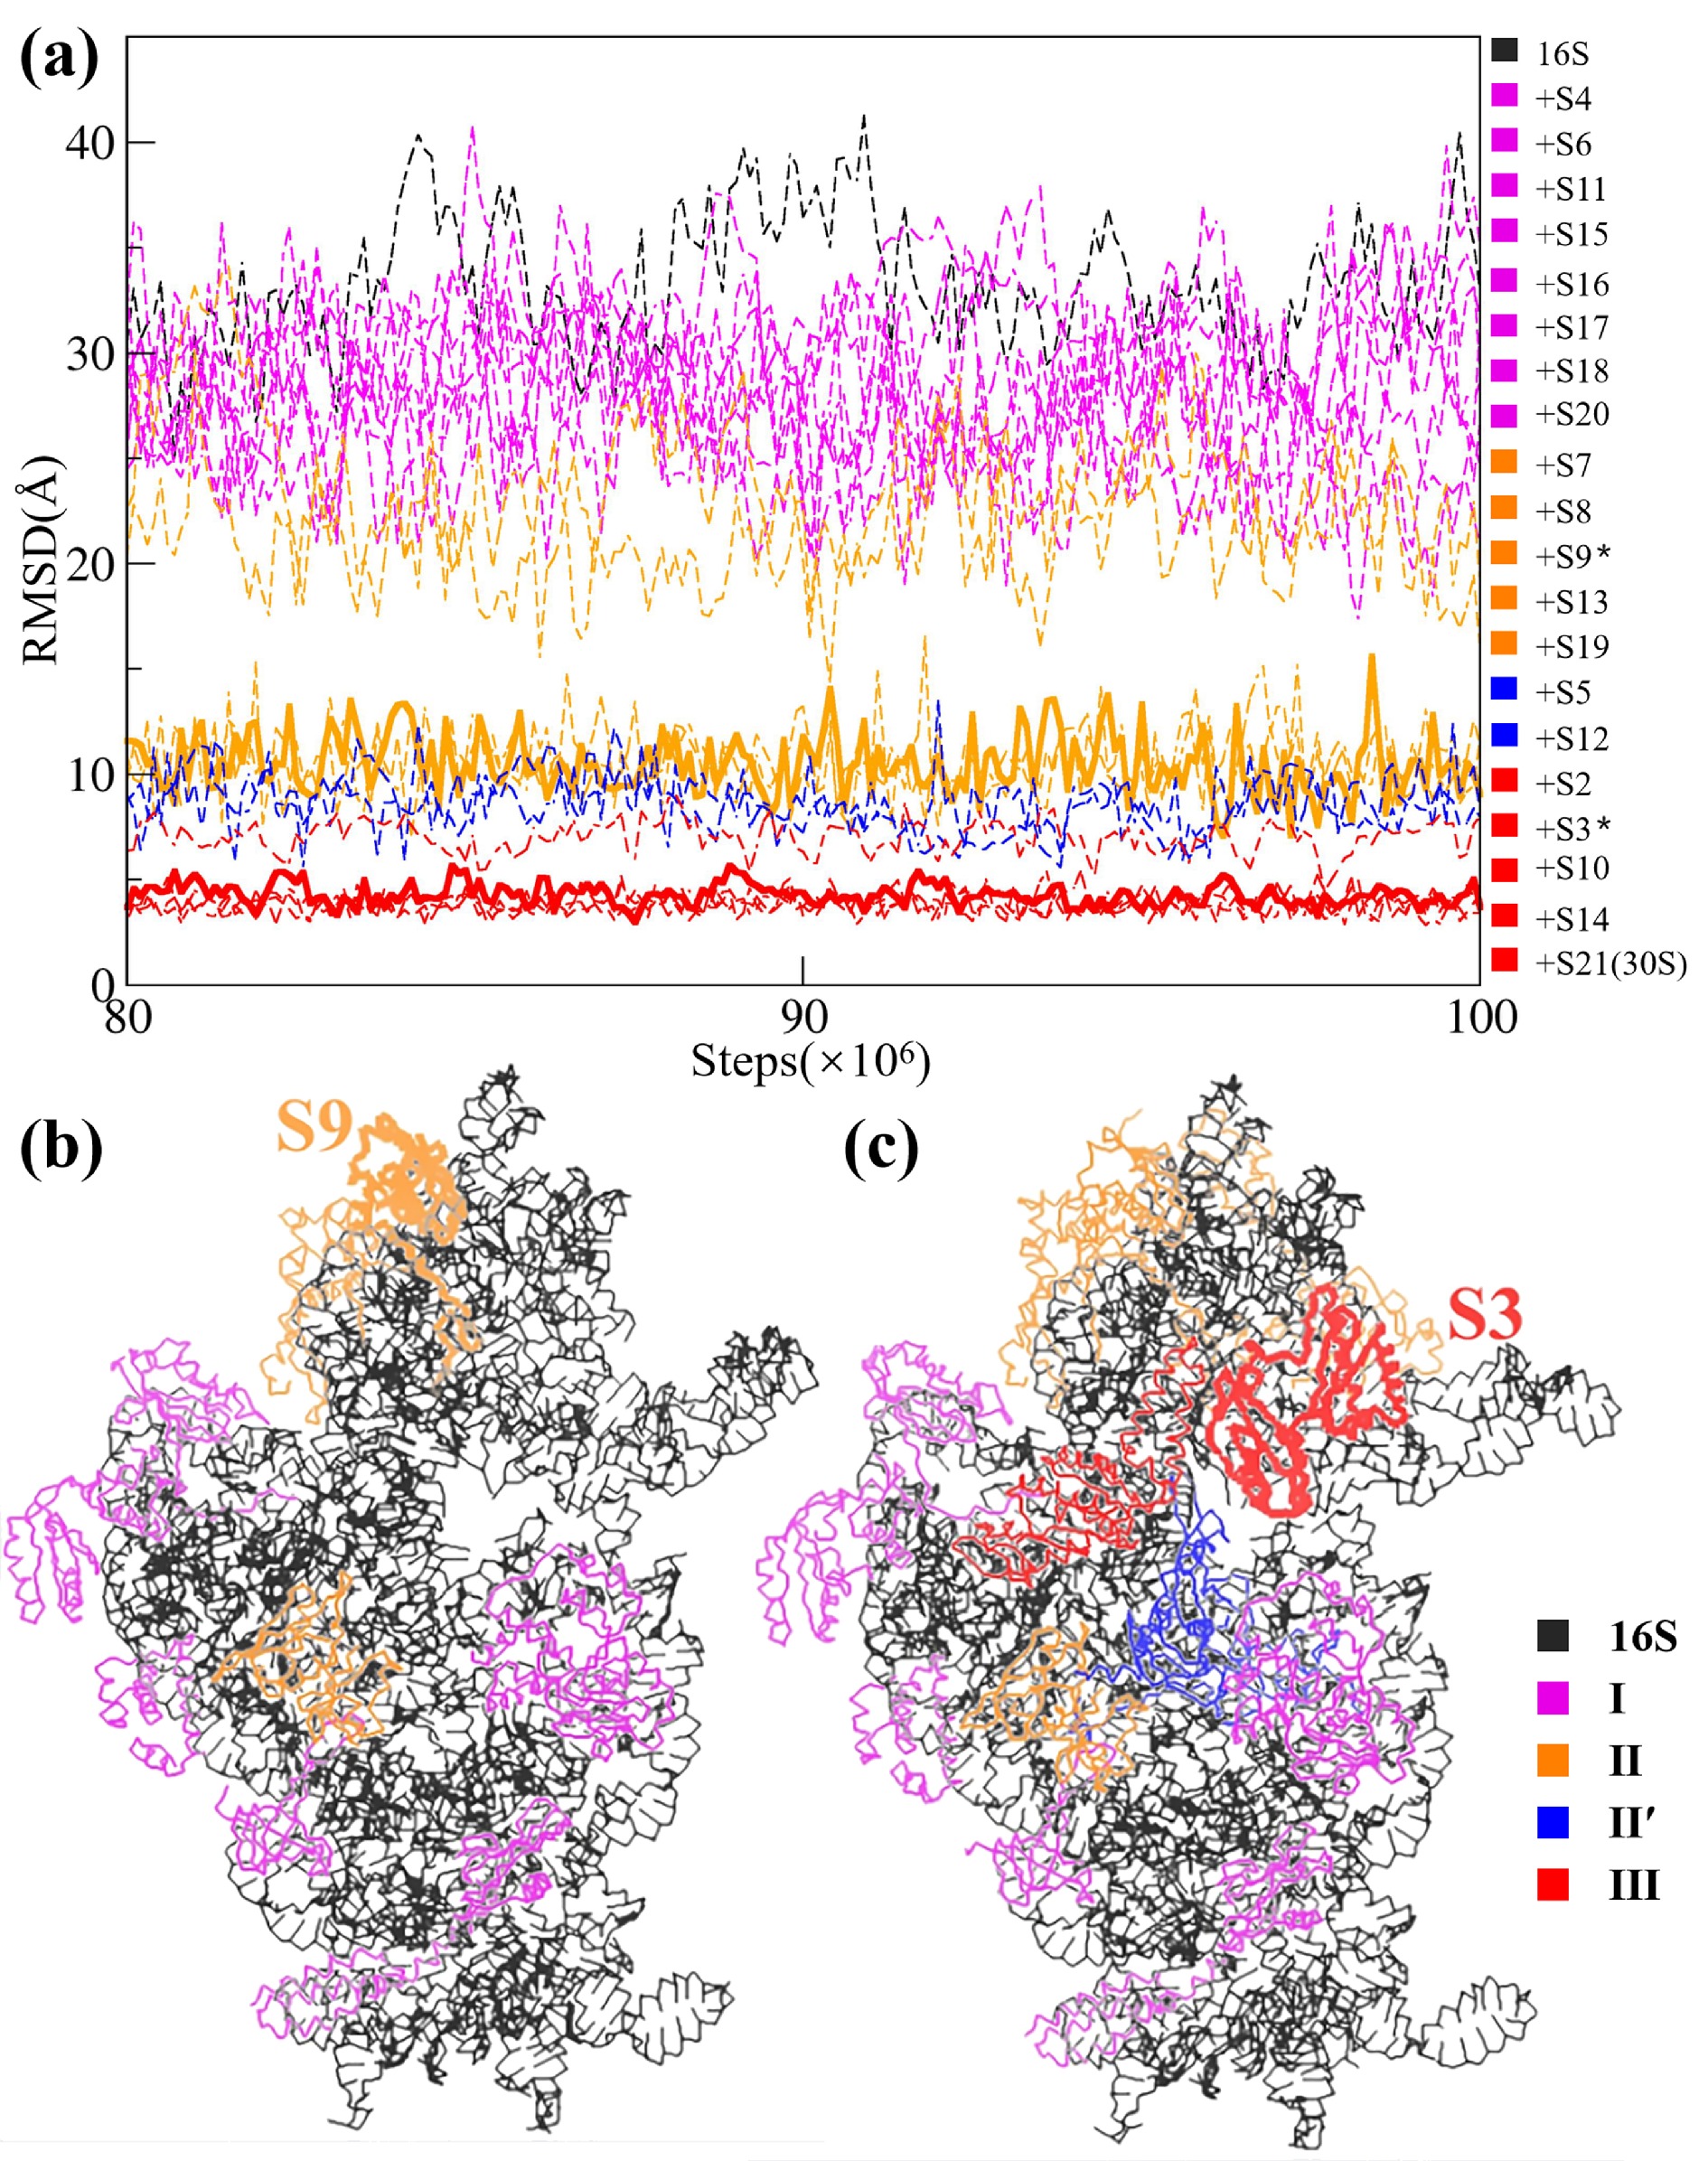
![]() The role of individual S proteins in the assembly of the 30S subunit. (a) Equilibriumed (from 80 to 100 million steps of the CG simulations) RMSD values of all the simulated systems. Starting from the naked 16S rRNA, then adding the S proteins one by one following the order shown in Table 1, and finally ending with the 30S subunit. The RMSD curves at the four stages are colored differently. In the color bar on the right side, the two dividing proteins (S9 and S3) are labeled by *. The two corresponding RMSD curves are shown by solid lines, while other curves are shown by dashed lines. (b) The position of S9. (c) The position of S3.
The role of individual S proteins in the assembly of the 30S subunit. (a) Equilibriumed (from 80 to 100 million steps of the CG simulations) RMSD values of all the simulated systems. Starting from the naked 16S rRNA, then adding the S proteins one by one following the order shown in Table 1, and finally ending with the 30S subunit. The RMSD curves at the four stages are colored differently. In the color bar on the right side, the two dividing proteins (S9 and S3) are labeled by *. The two corresponding RMSD curves are shown by solid lines, while other curves are shown by dashed lines. (b) The position of S9. (c) The position of S3.
-
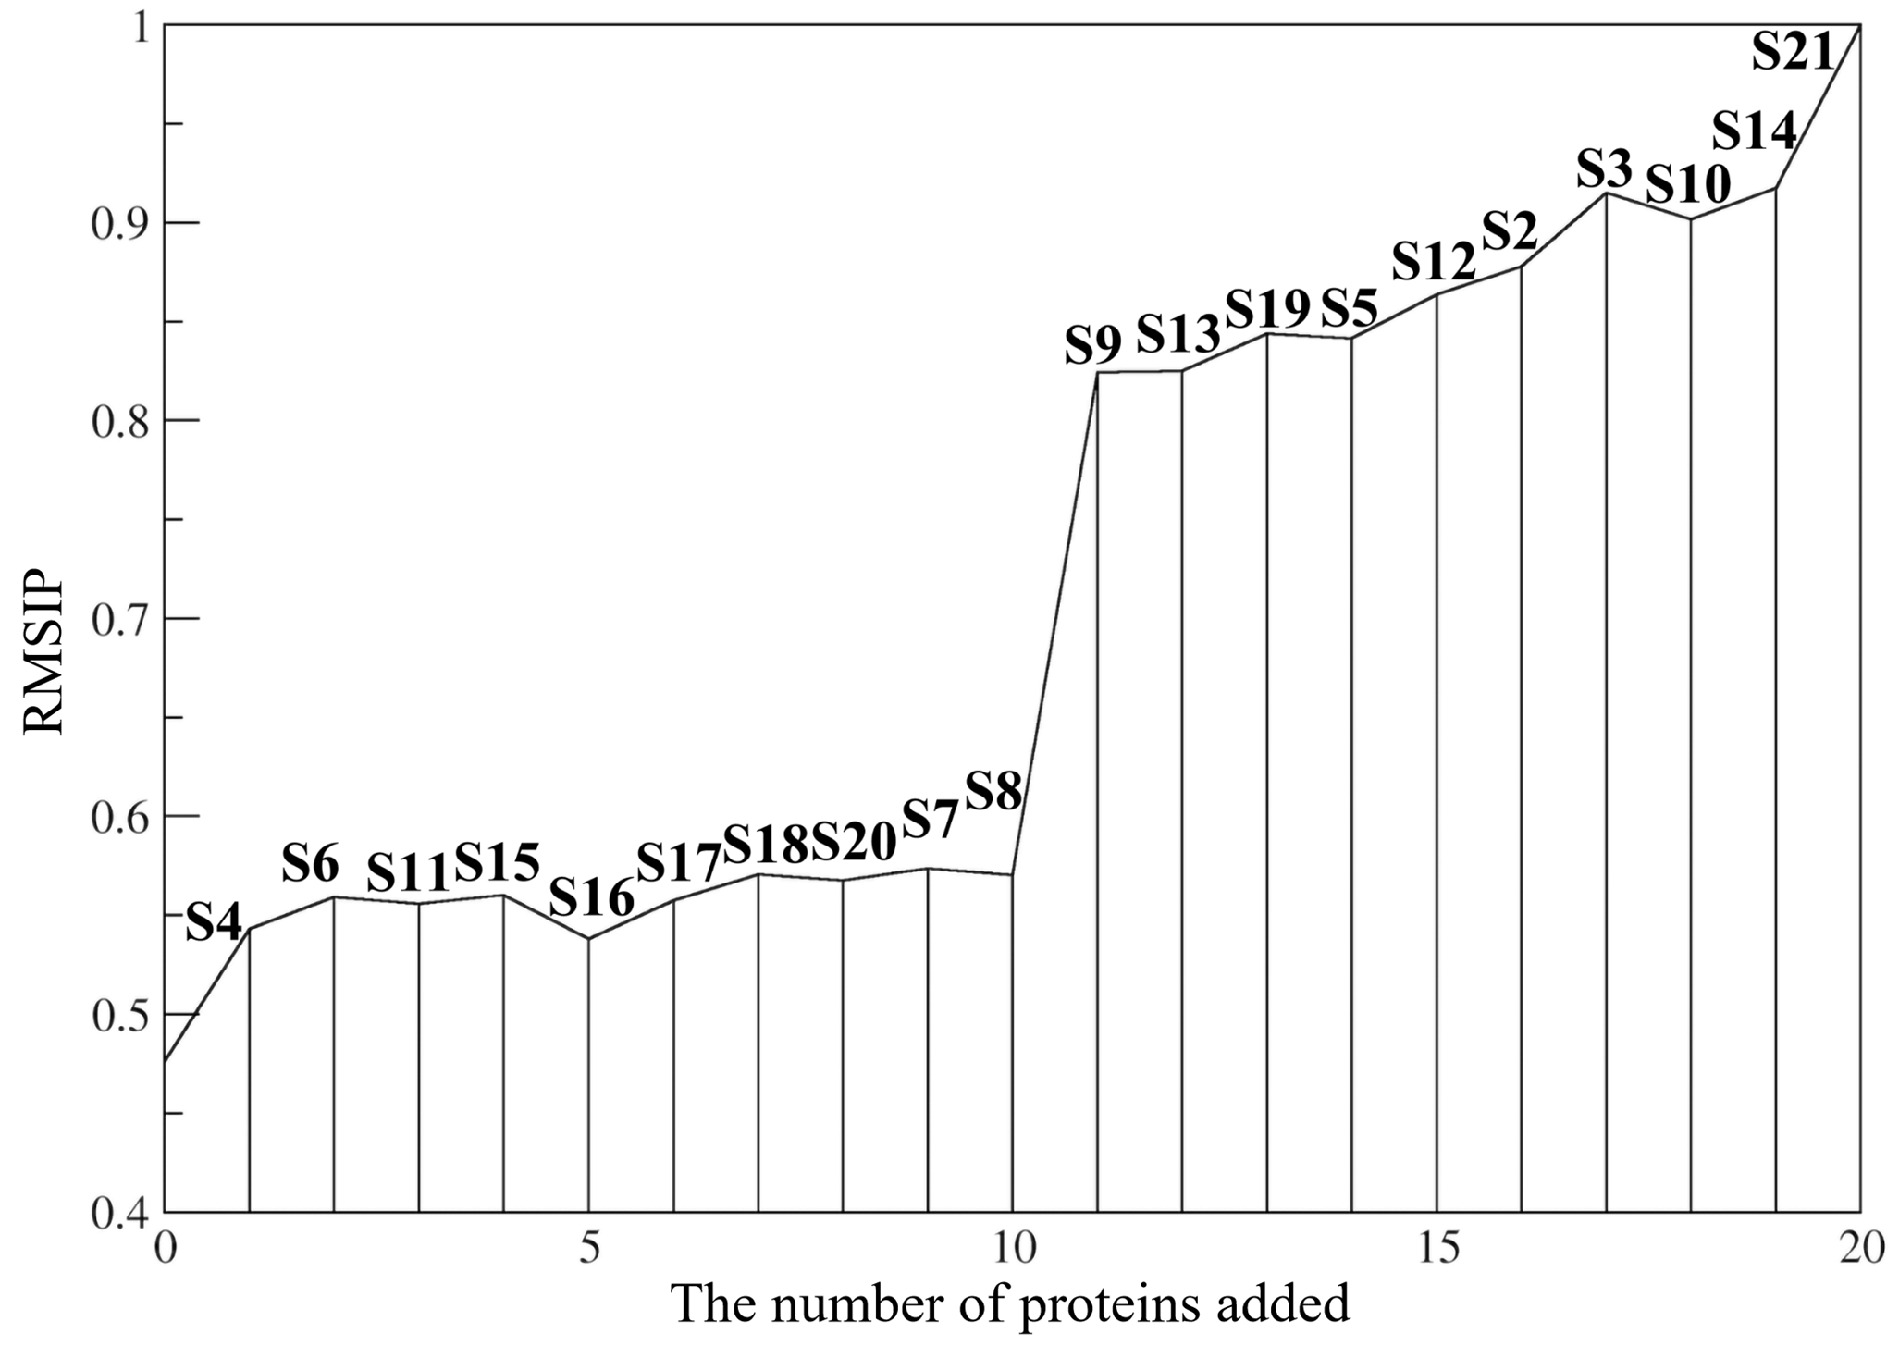
![]() Evolution of RMSIP in the assembly process of the 30S subunit. The x-axis represents the assembly order of the S proteins shown in Table 1. For each system, the RMSIP was calculated between the PCA modes of the system and those of the 30S subunit. The RMSIP ends at 1.0 because the system is the 30S subunit after S21 is assembled.
Evolution of RMSIP in the assembly process of the 30S subunit. The x-axis represents the assembly order of the S proteins shown in Table 1. For each system, the RMSIP was calculated between the PCA modes of the system and those of the 30S subunit. The RMSIP ends at 1.0 because the system is the 30S subunit after S21 is assembled.
-
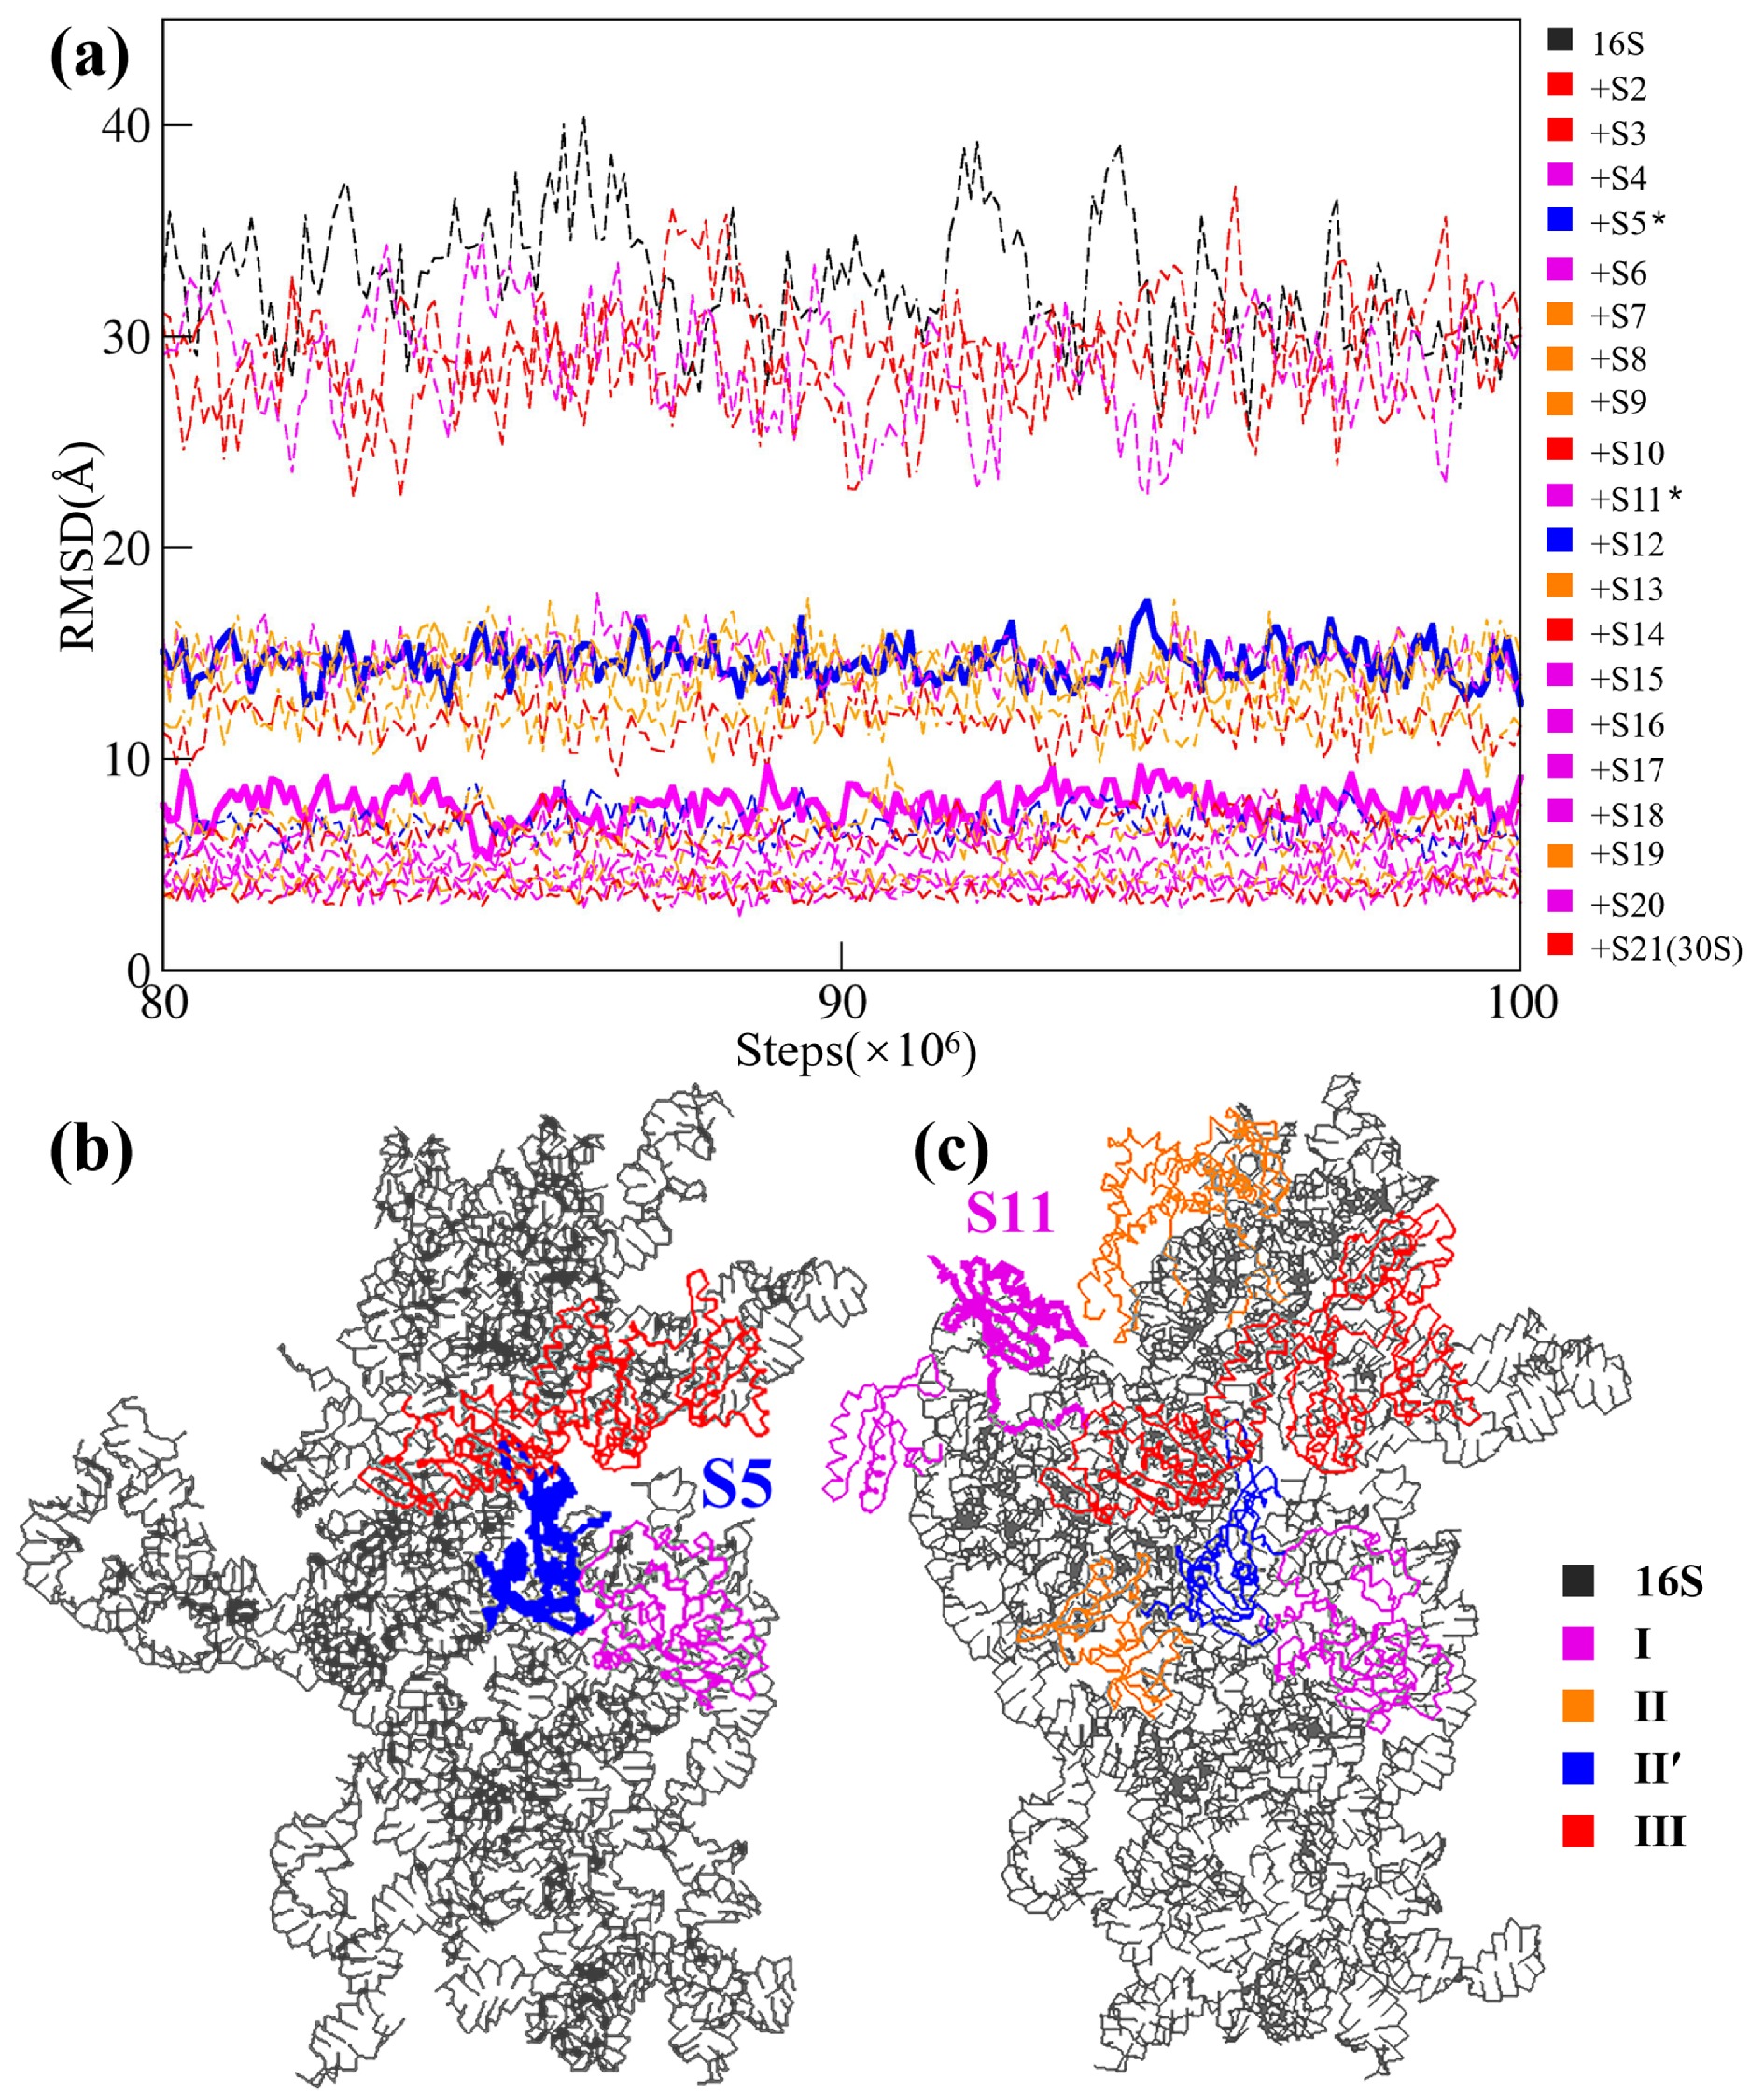
![]() The role of individual S proteins in a switched assembly order of the 30S subunit. (a) Equilibriumed (from 80 to 100 million steps of the CG simulations) RMSD values of all the simulated systems. Starting from the naked 16S rRNA, then adding the S proteins one by one in descending order of their molecular weights, and finally ending with the 30S subunit. The RMSD curves are colored according to the stages to which the corresponding S proteins belong, as shown in Fig. 5a. In the color bar on the right side, the two dividing proteins (S5 and S11) are labeled by *. The two corresponding RMSD curves are shown by solid lines, while other curves are shown by dashed lines. (b) The position of S5. (c) The position of S11.
The role of individual S proteins in a switched assembly order of the 30S subunit. (a) Equilibriumed (from 80 to 100 million steps of the CG simulations) RMSD values of all the simulated systems. Starting from the naked 16S rRNA, then adding the S proteins one by one in descending order of their molecular weights, and finally ending with the 30S subunit. The RMSD curves are colored according to the stages to which the corresponding S proteins belong, as shown in Fig. 5a. In the color bar on the right side, the two dividing proteins (S5 and S11) are labeled by *. The two corresponding RMSD curves are shown by solid lines, while other curves are shown by dashed lines. (b) The position of S5. (c) The position of S11.