 Download:
Figures of the Article
-
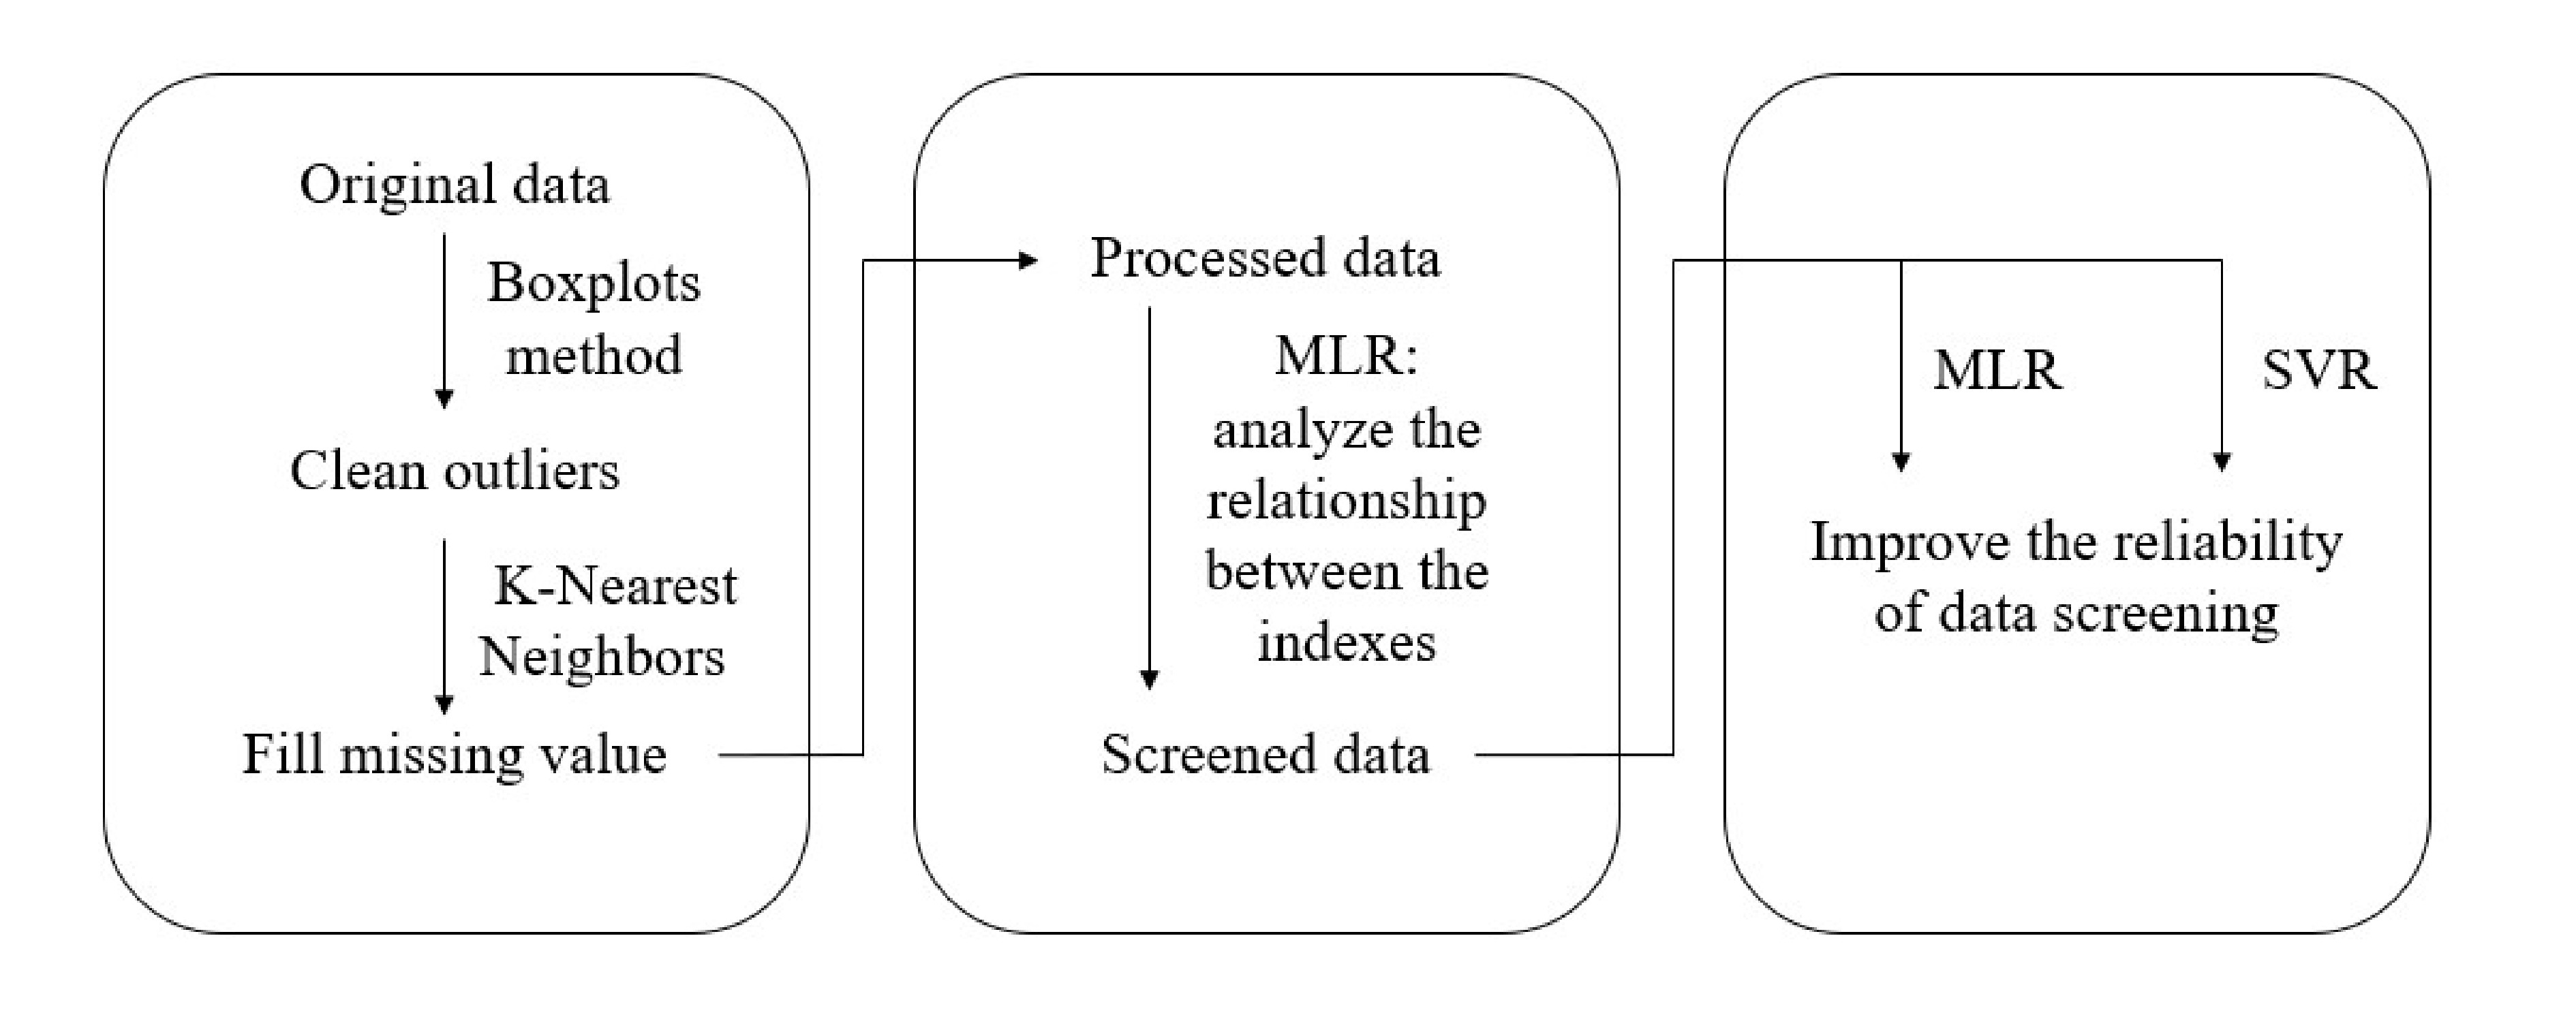
![]() The pipeline of MLR and SVR models for clinical datasets.
The pipeline of MLR and SVR models for clinical datasets.
-
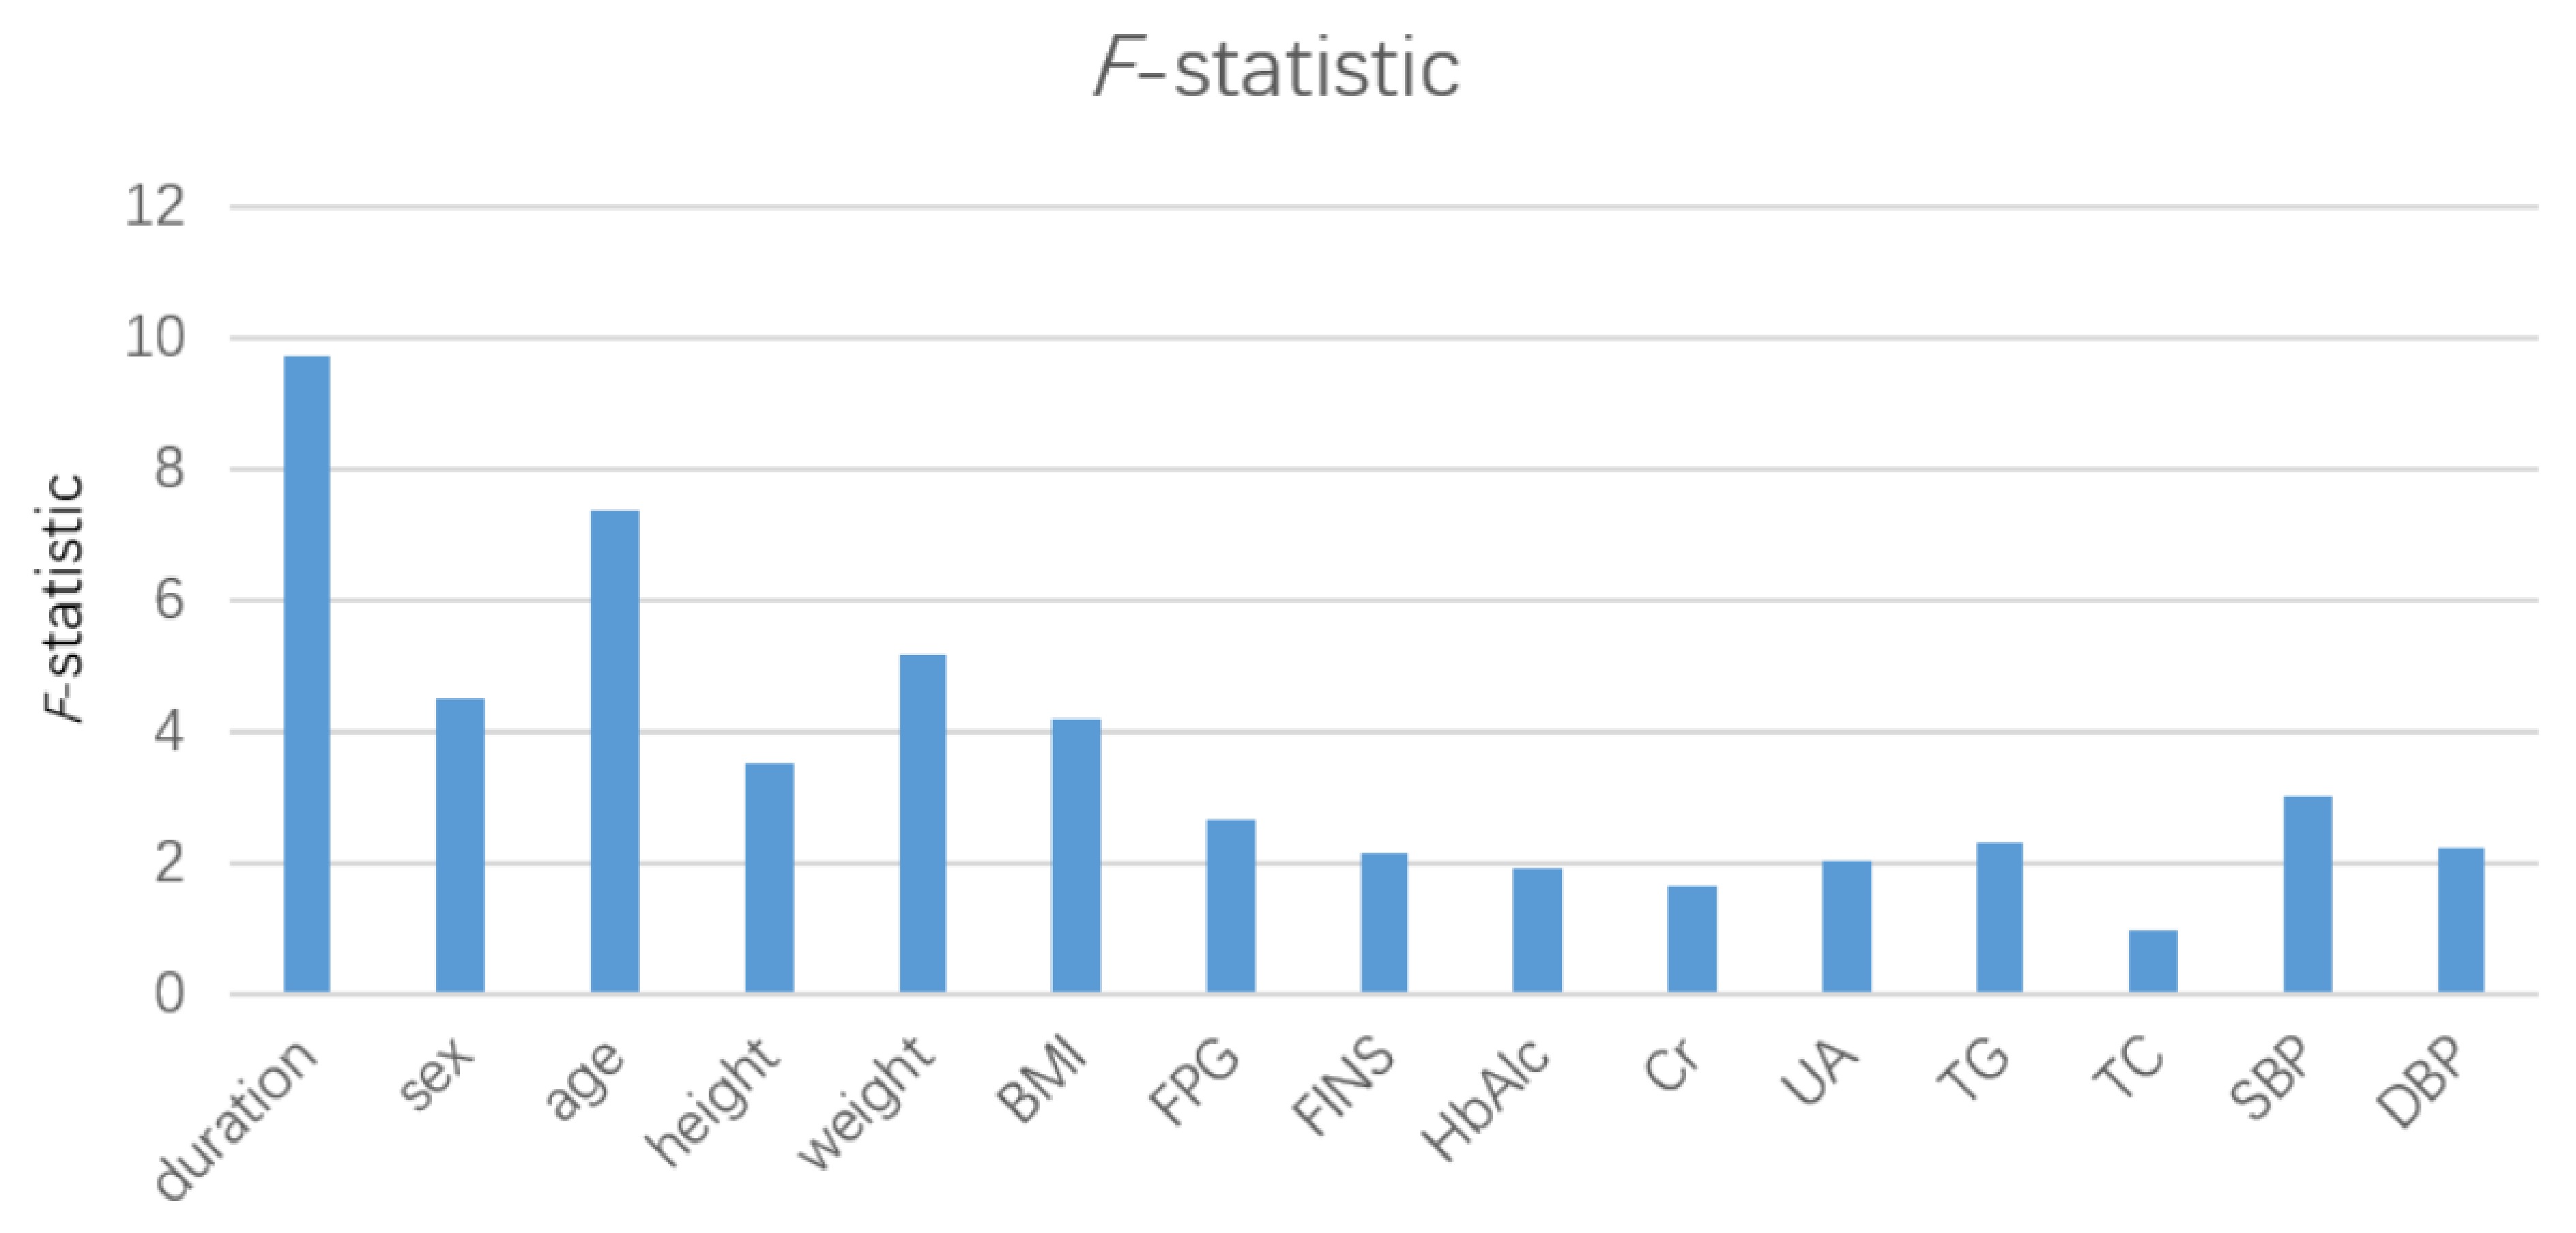
![]() F-statistic in the multivariate linear regression model.
F-statistic in the multivariate linear regression model.
-
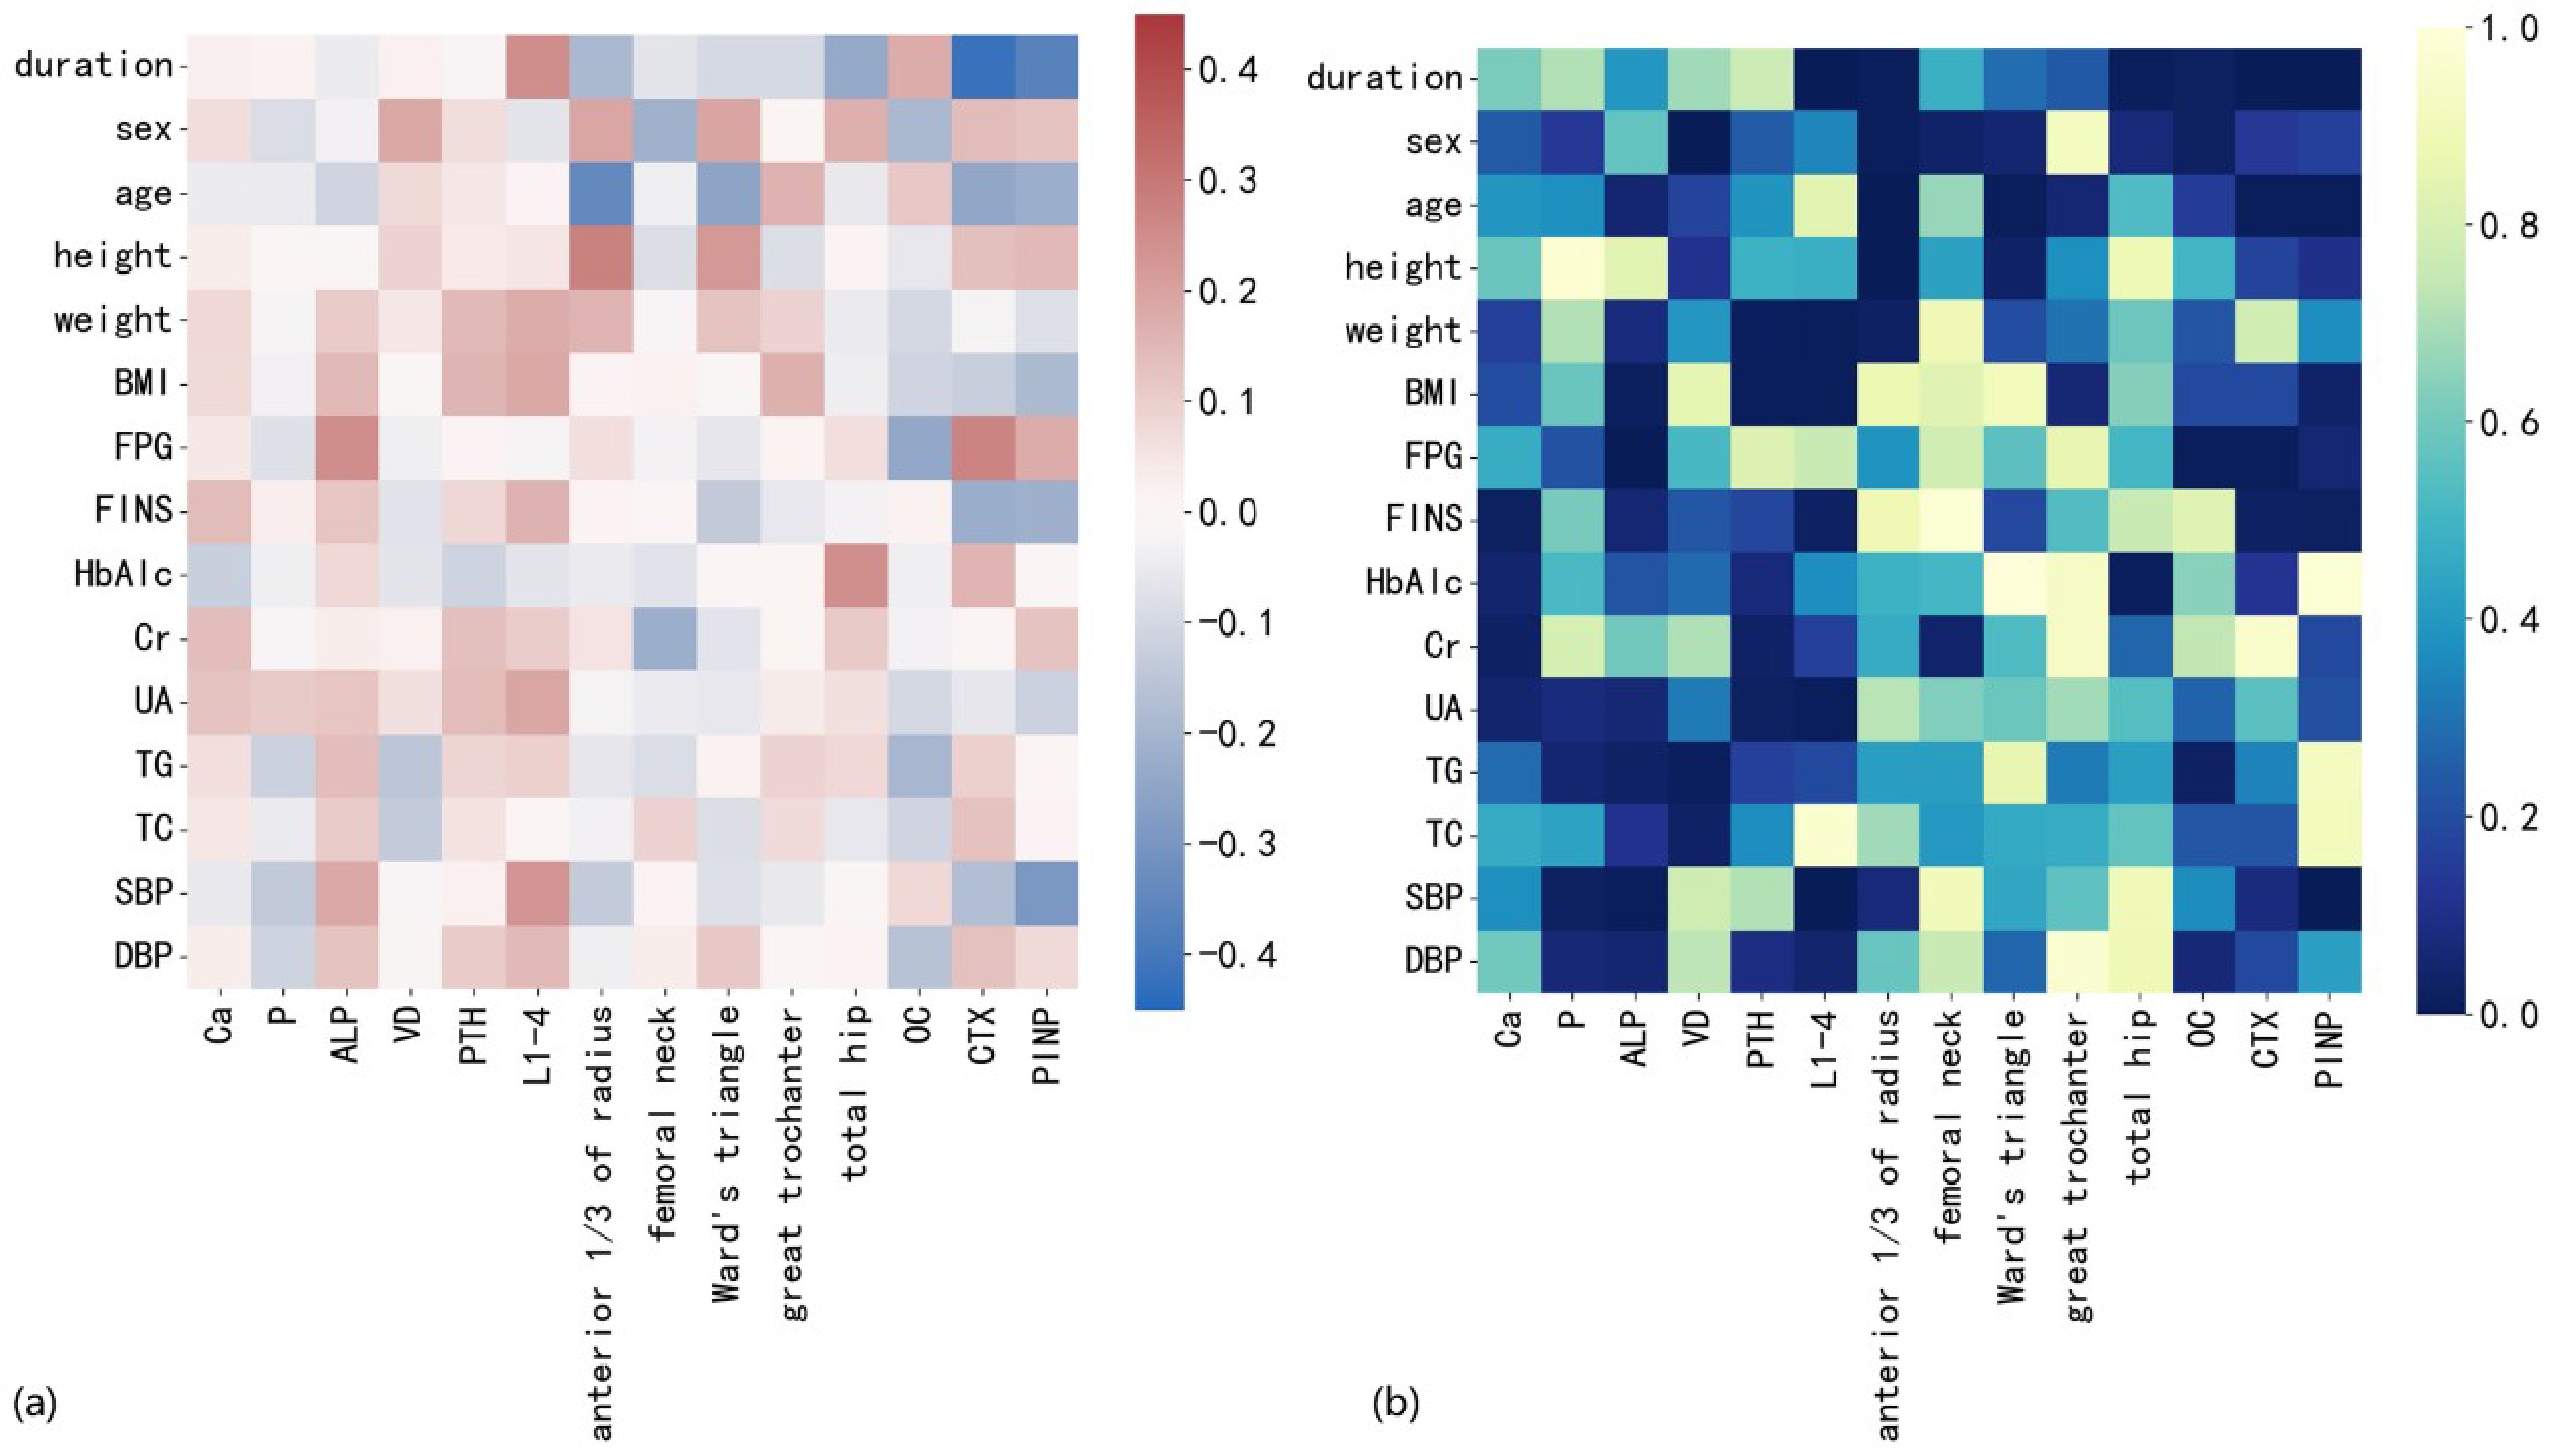
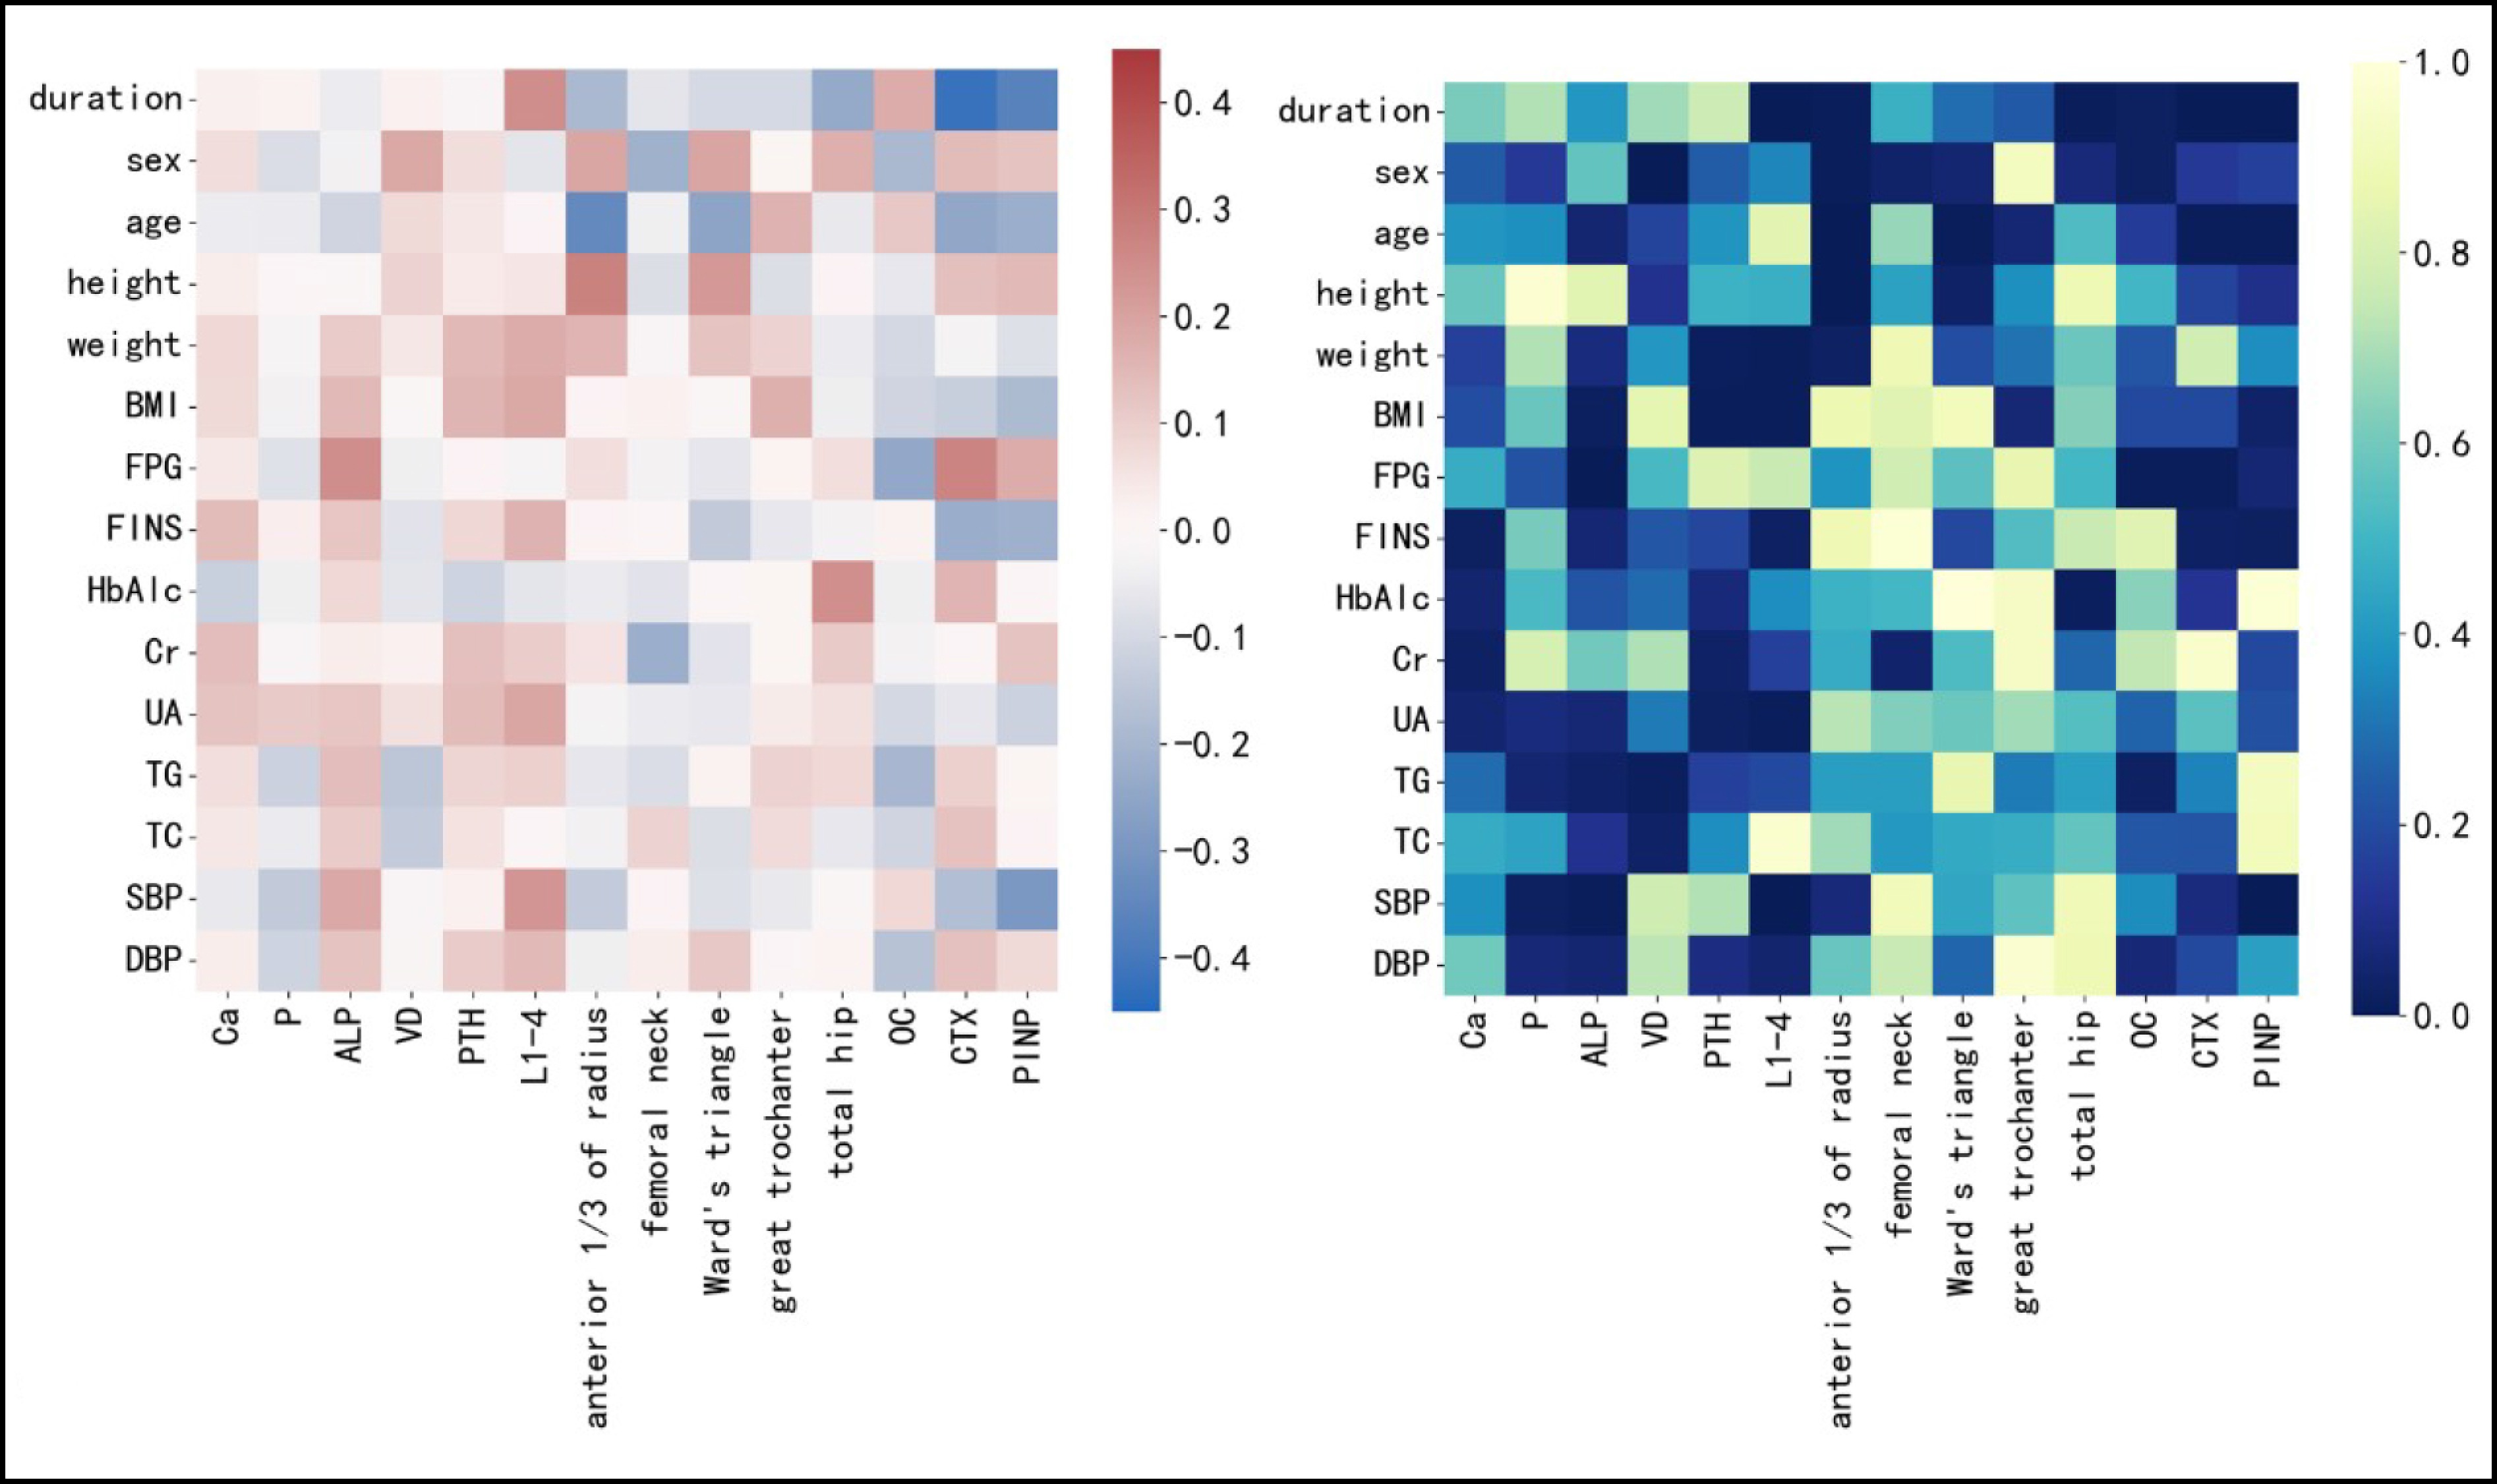
![]() (a) Thermodynamic diagram of multiple linear regression equation coefficient (red represents positive correlation, blue represents negative correlation, and the darker the color, the larger the absolute value of the coefficient); (b) p value thermodynamic diagram of bone metabolism index and other data (the darker the color, the smaller the p value).
(a) Thermodynamic diagram of multiple linear regression equation coefficient (red represents positive correlation, blue represents negative correlation, and the darker the color, the larger the absolute value of the coefficient); (b) p value thermodynamic diagram of bone metabolism index and other data (the darker the color, the smaller the p value).
-
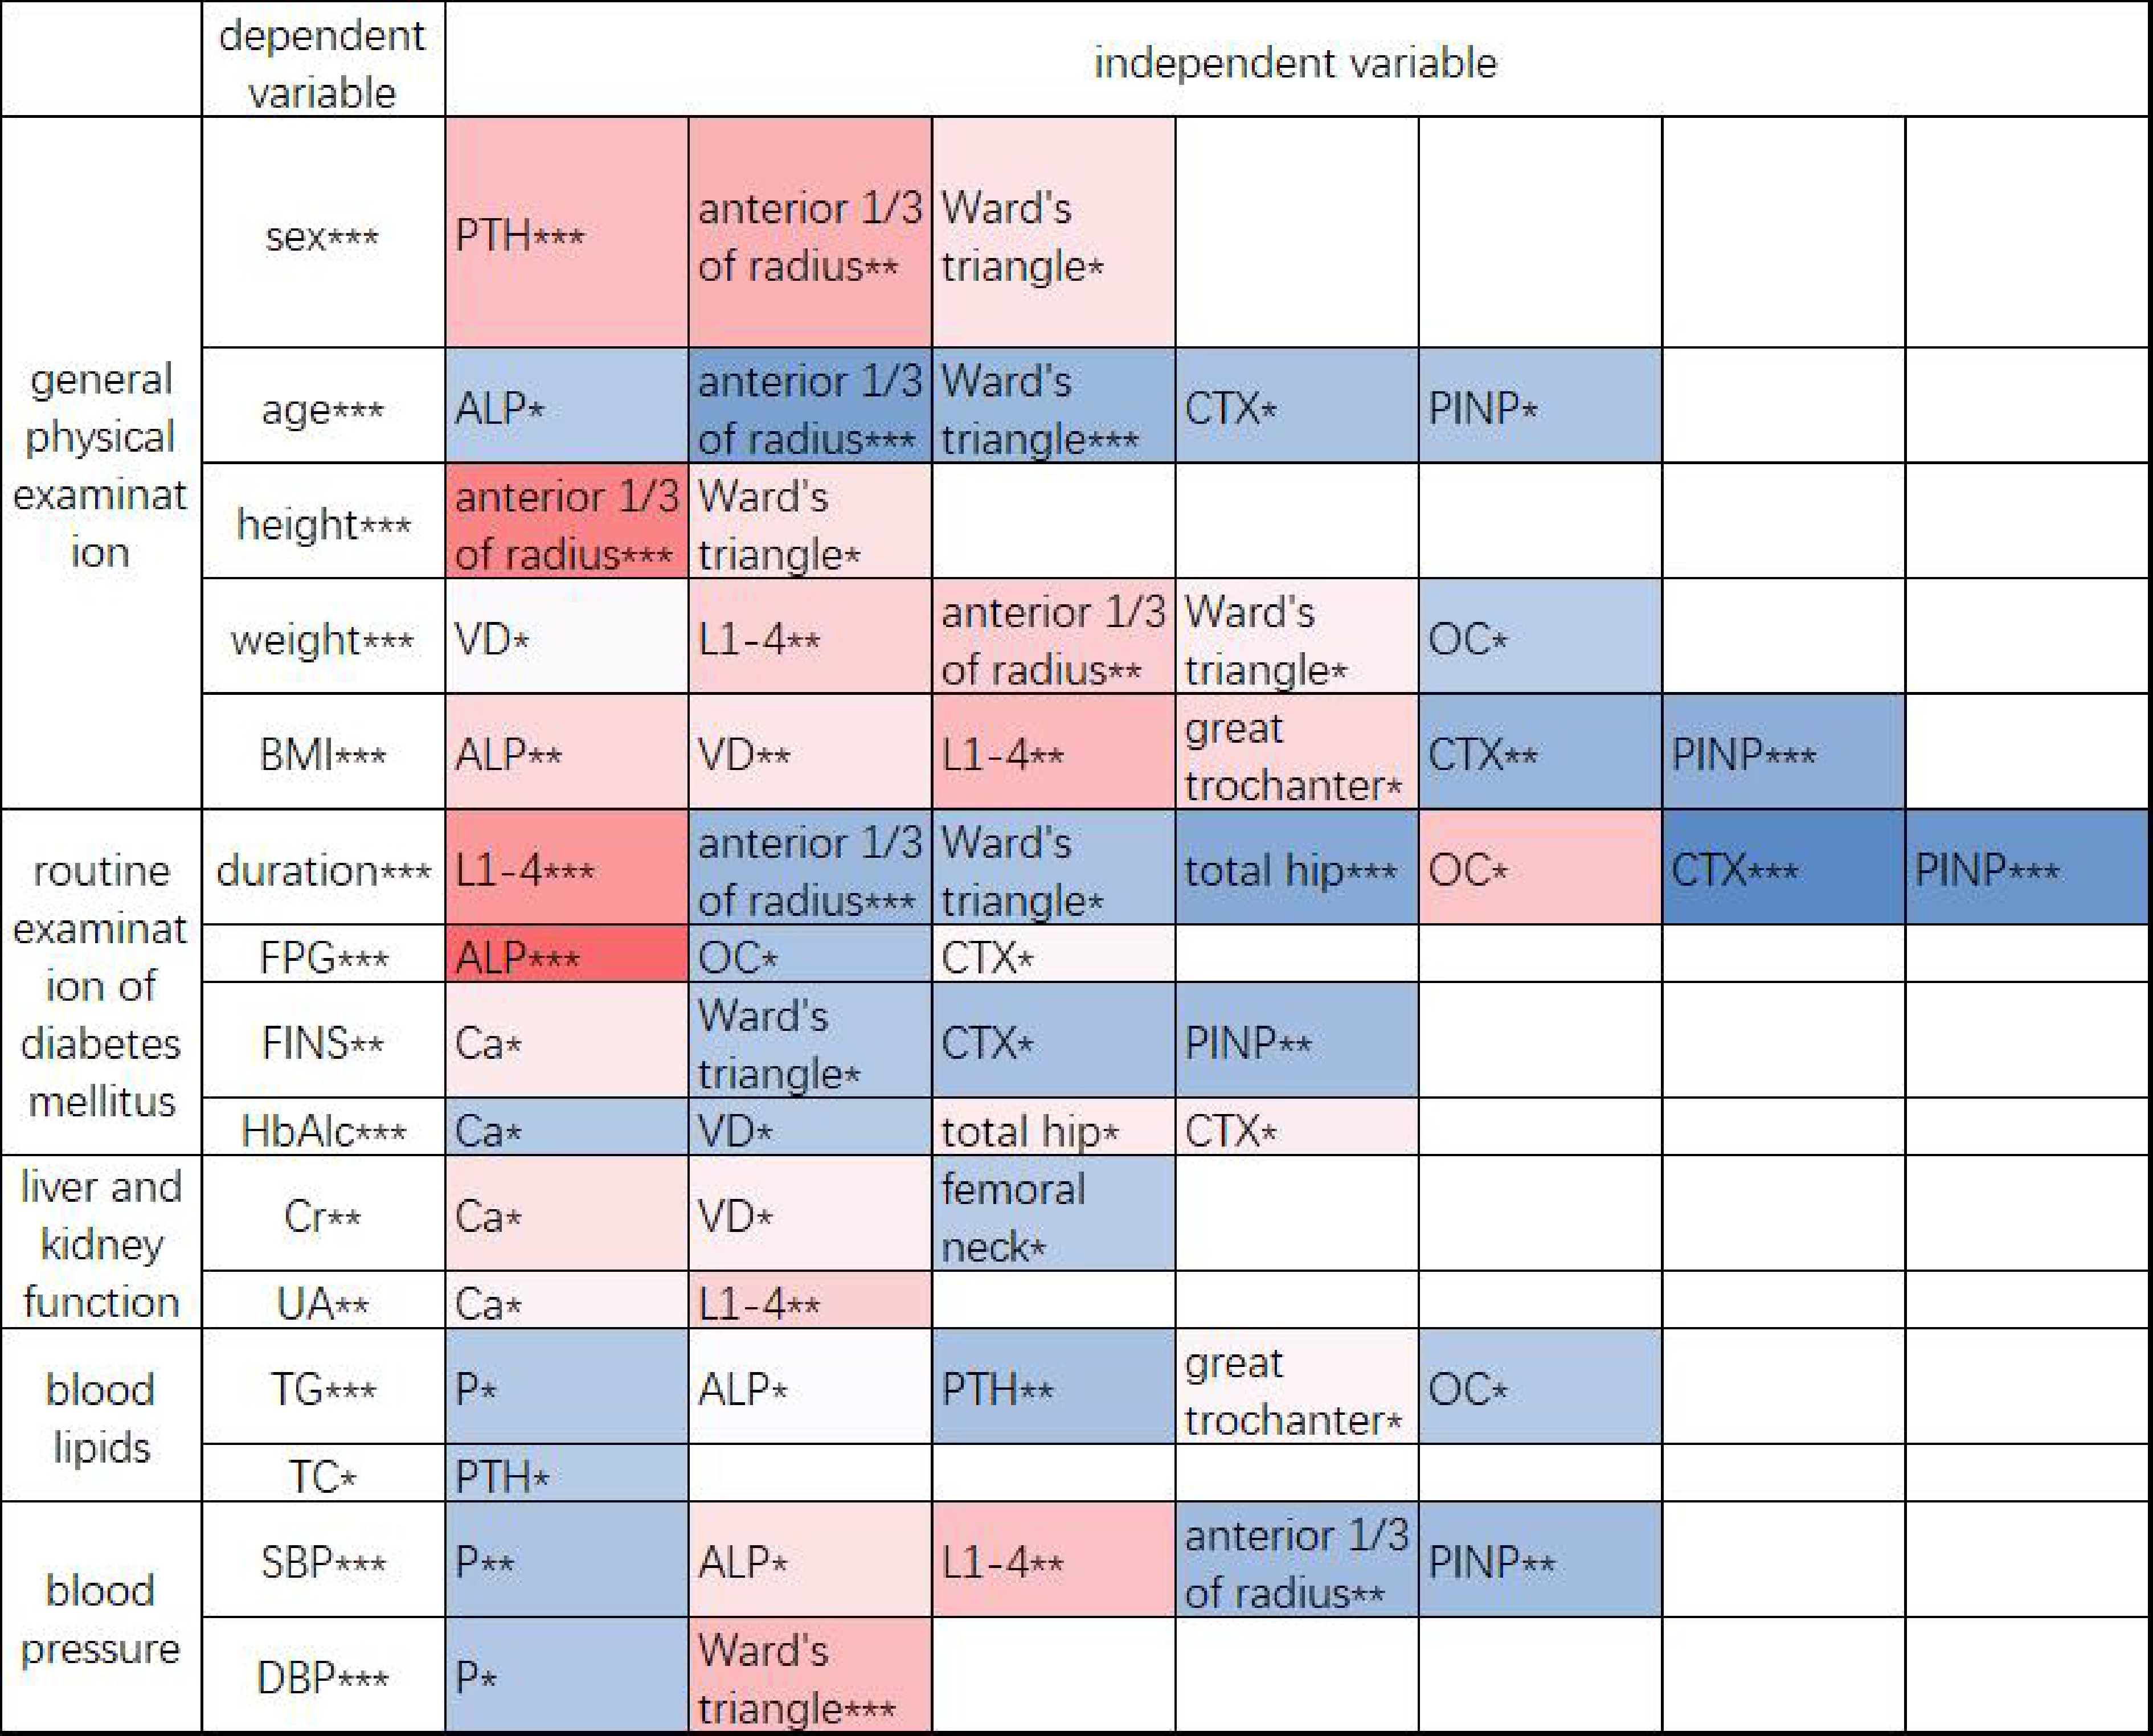
![]() Thermodynamic diagram of the final equation coefficient of stepwise multiple linear regression. Red represents a positive correlation, and blue represents a negative correlation. The darker the color is, the larger the absolute value of the coefficient. *: p<0.05,**: p<0.01,***: p<0.001.
Thermodynamic diagram of the final equation coefficient of stepwise multiple linear regression. Red represents a positive correlation, and blue represents a negative correlation. The darker the color is, the larger the absolute value of the coefficient. *: p<0.05,**: p<0.01,***: p<0.001.
-
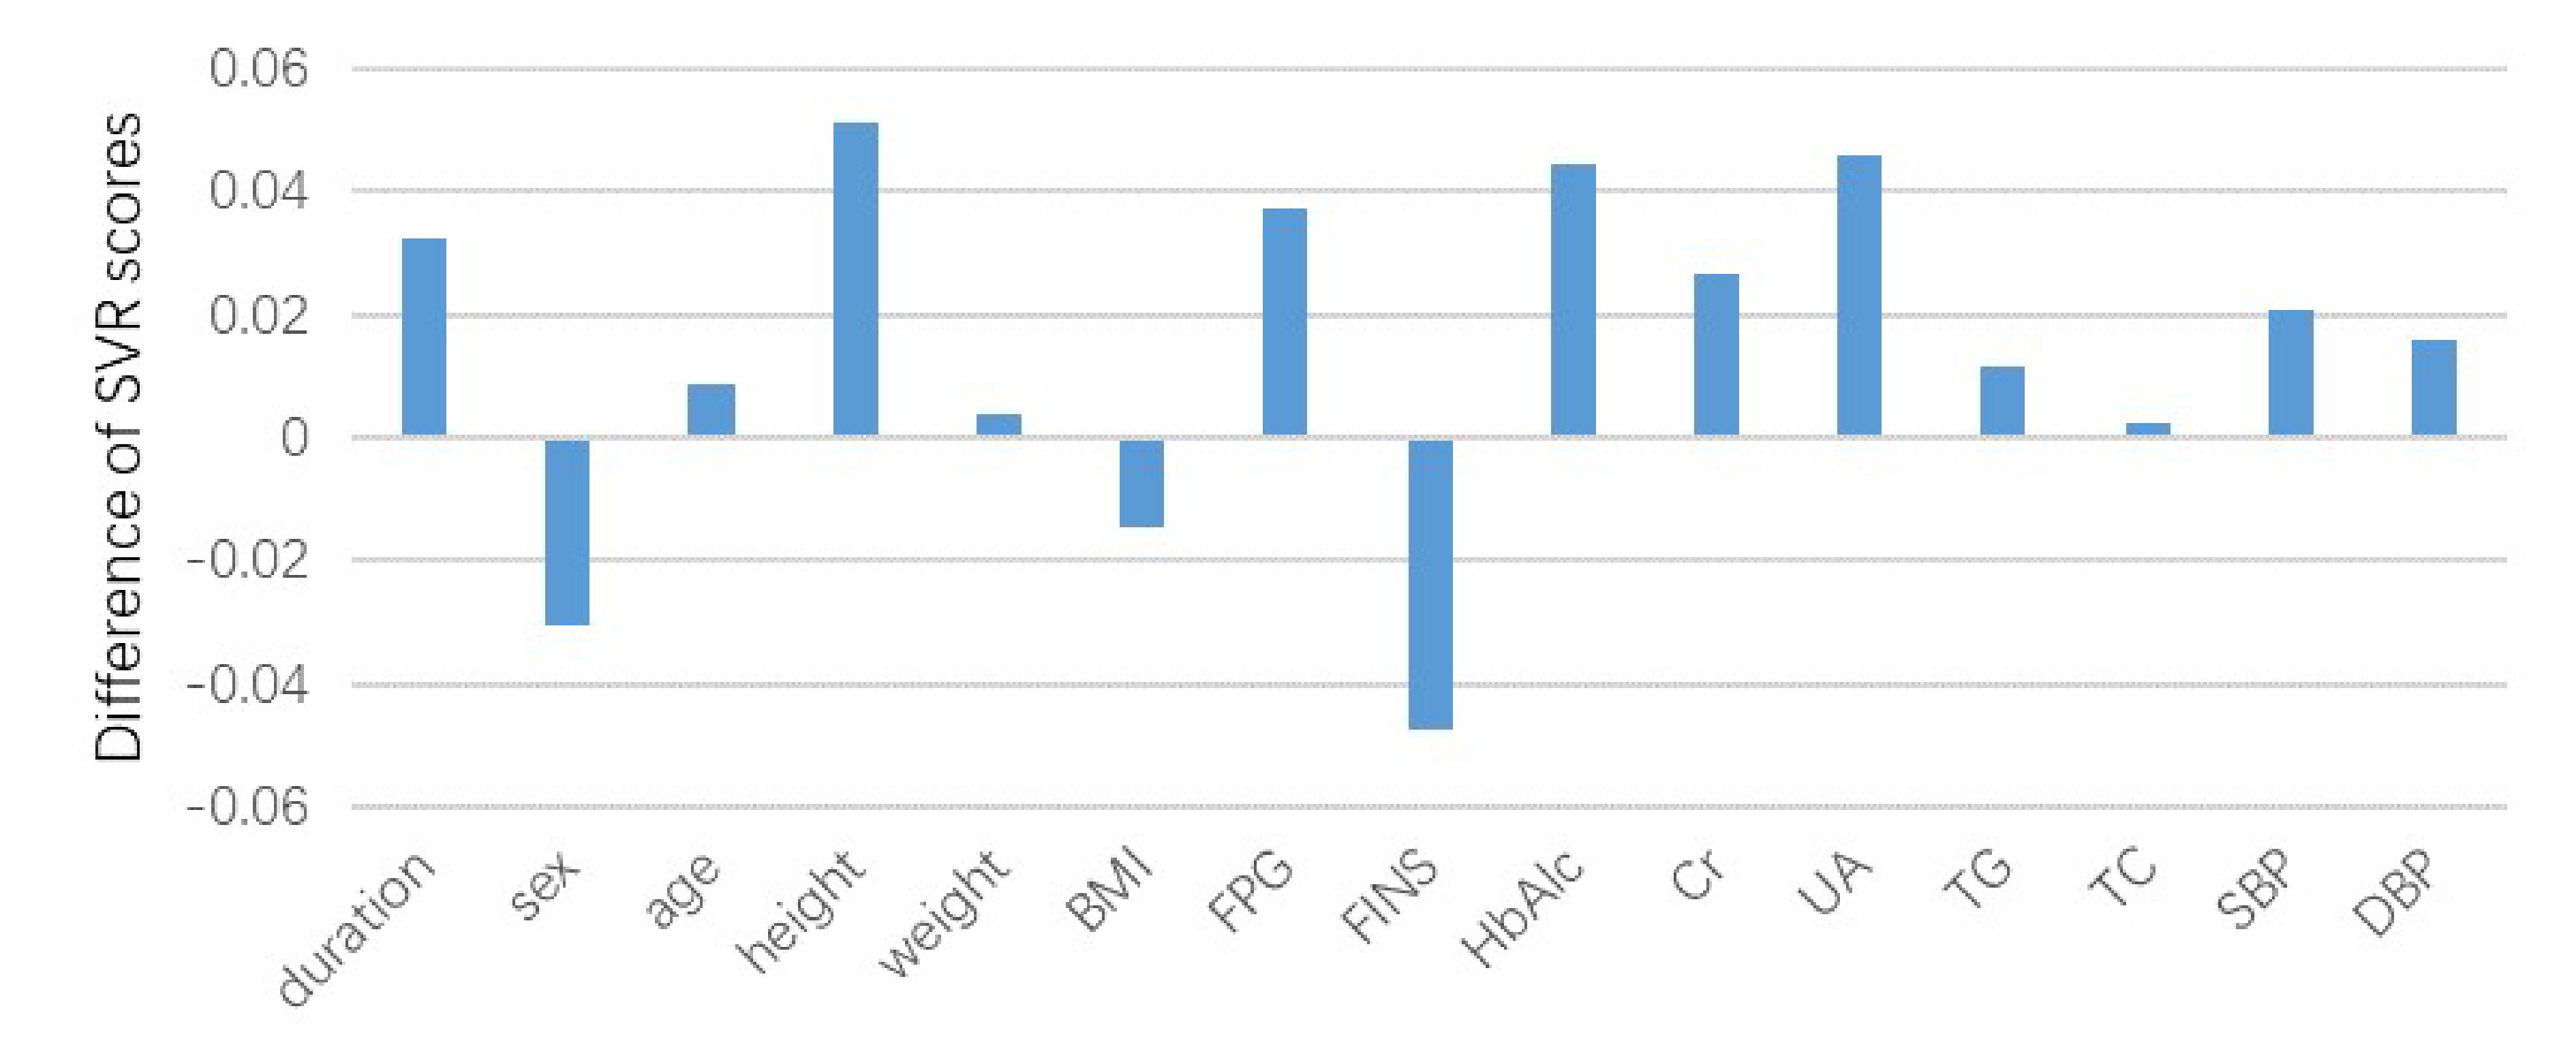
![]() Differences in support vector regression model scores before and after screening.
Differences in support vector regression model scores before and after screening.