
 Download:
Figures of the Article
-
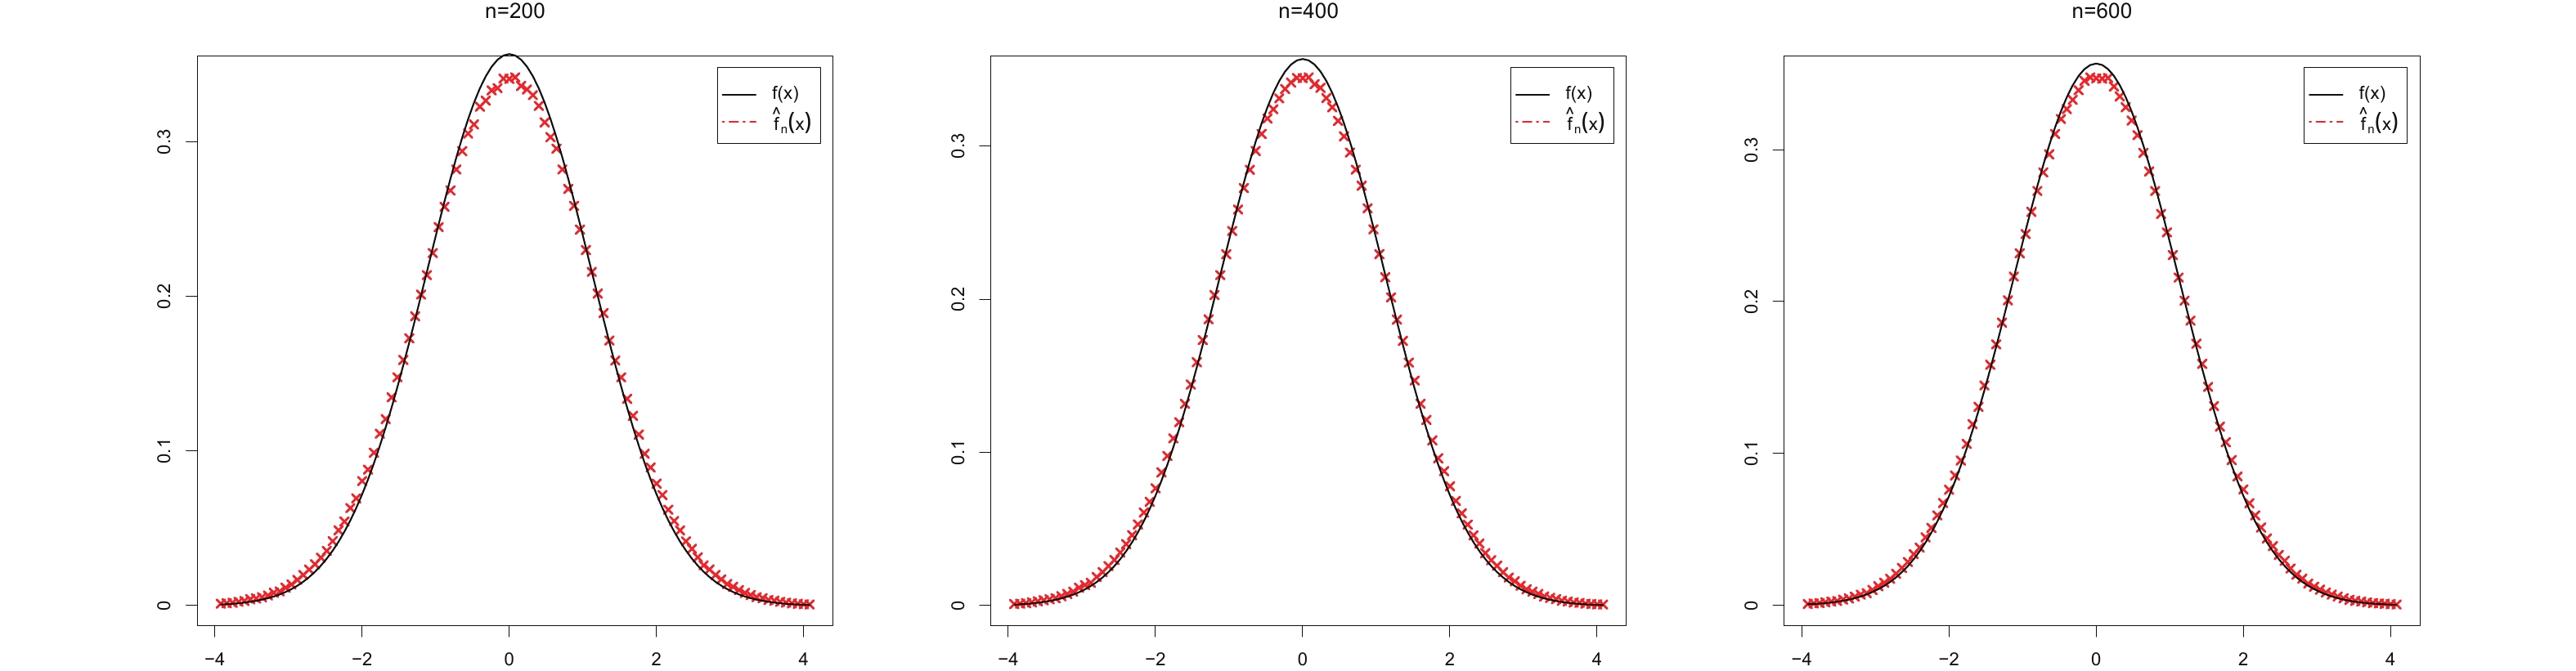
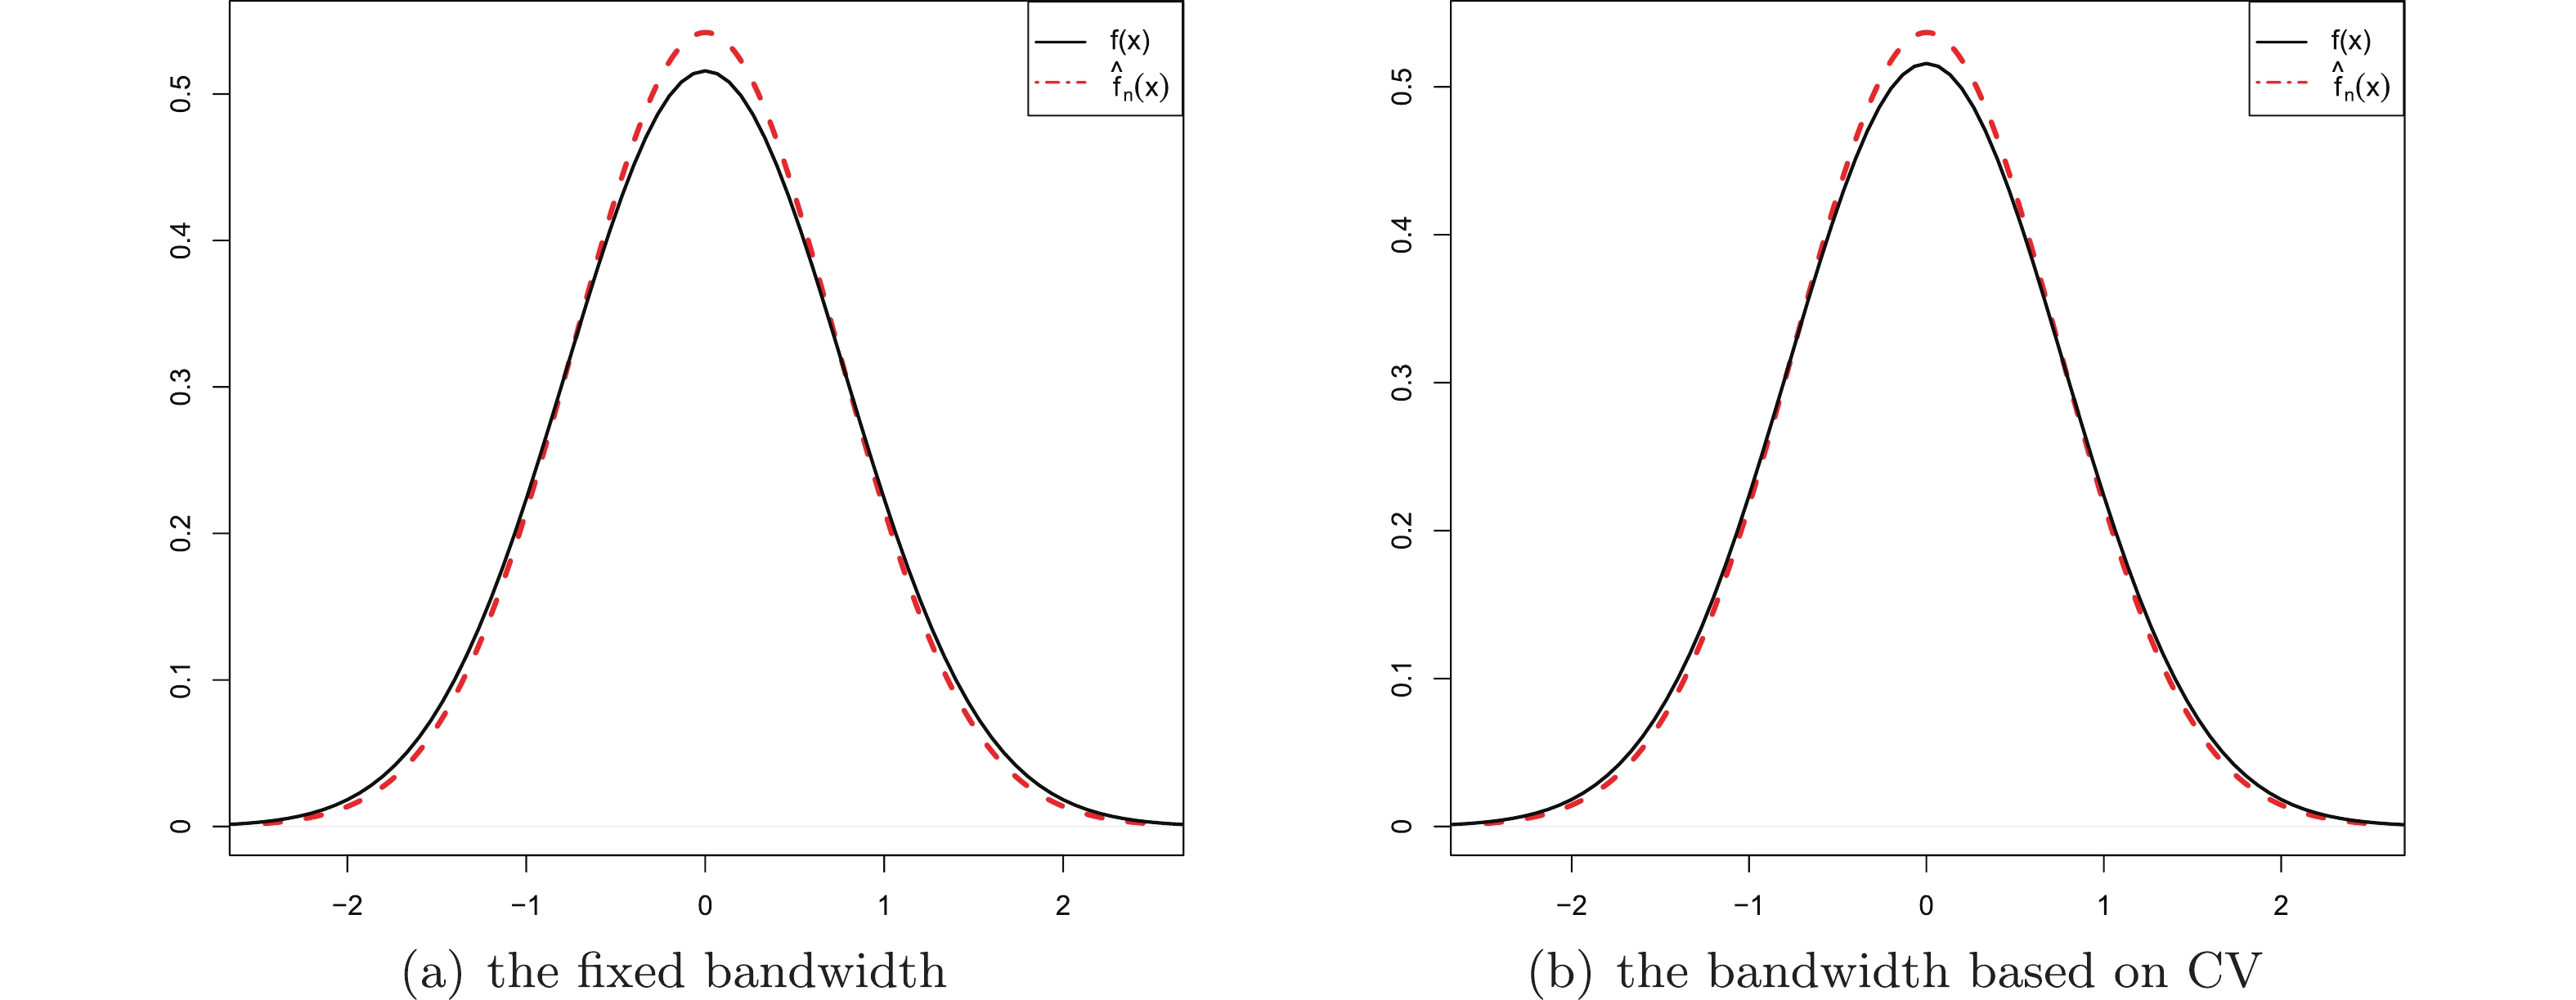
![]() Comparison of
Comparison of ˆfn(x) andf(x) for the fixed bandwidthhn=n−1/5 . -
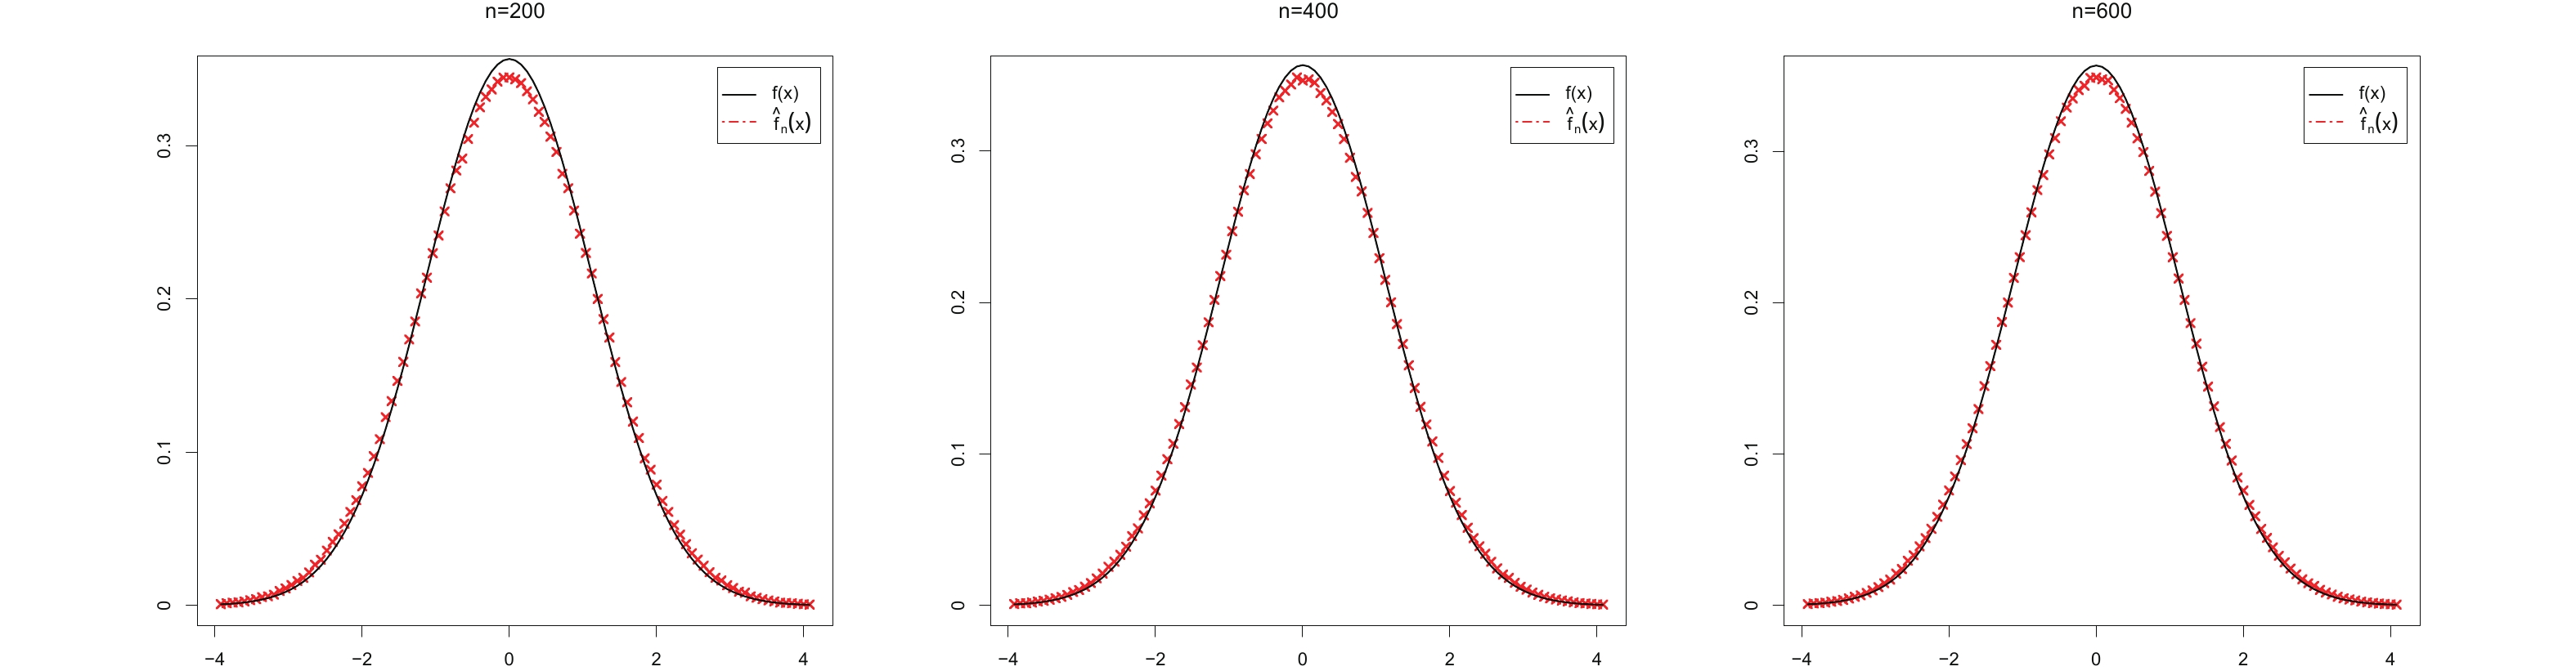
![]() Comparison of
Comparison of ˆfn(x) andf(x) for the bandwidth based on CV. -
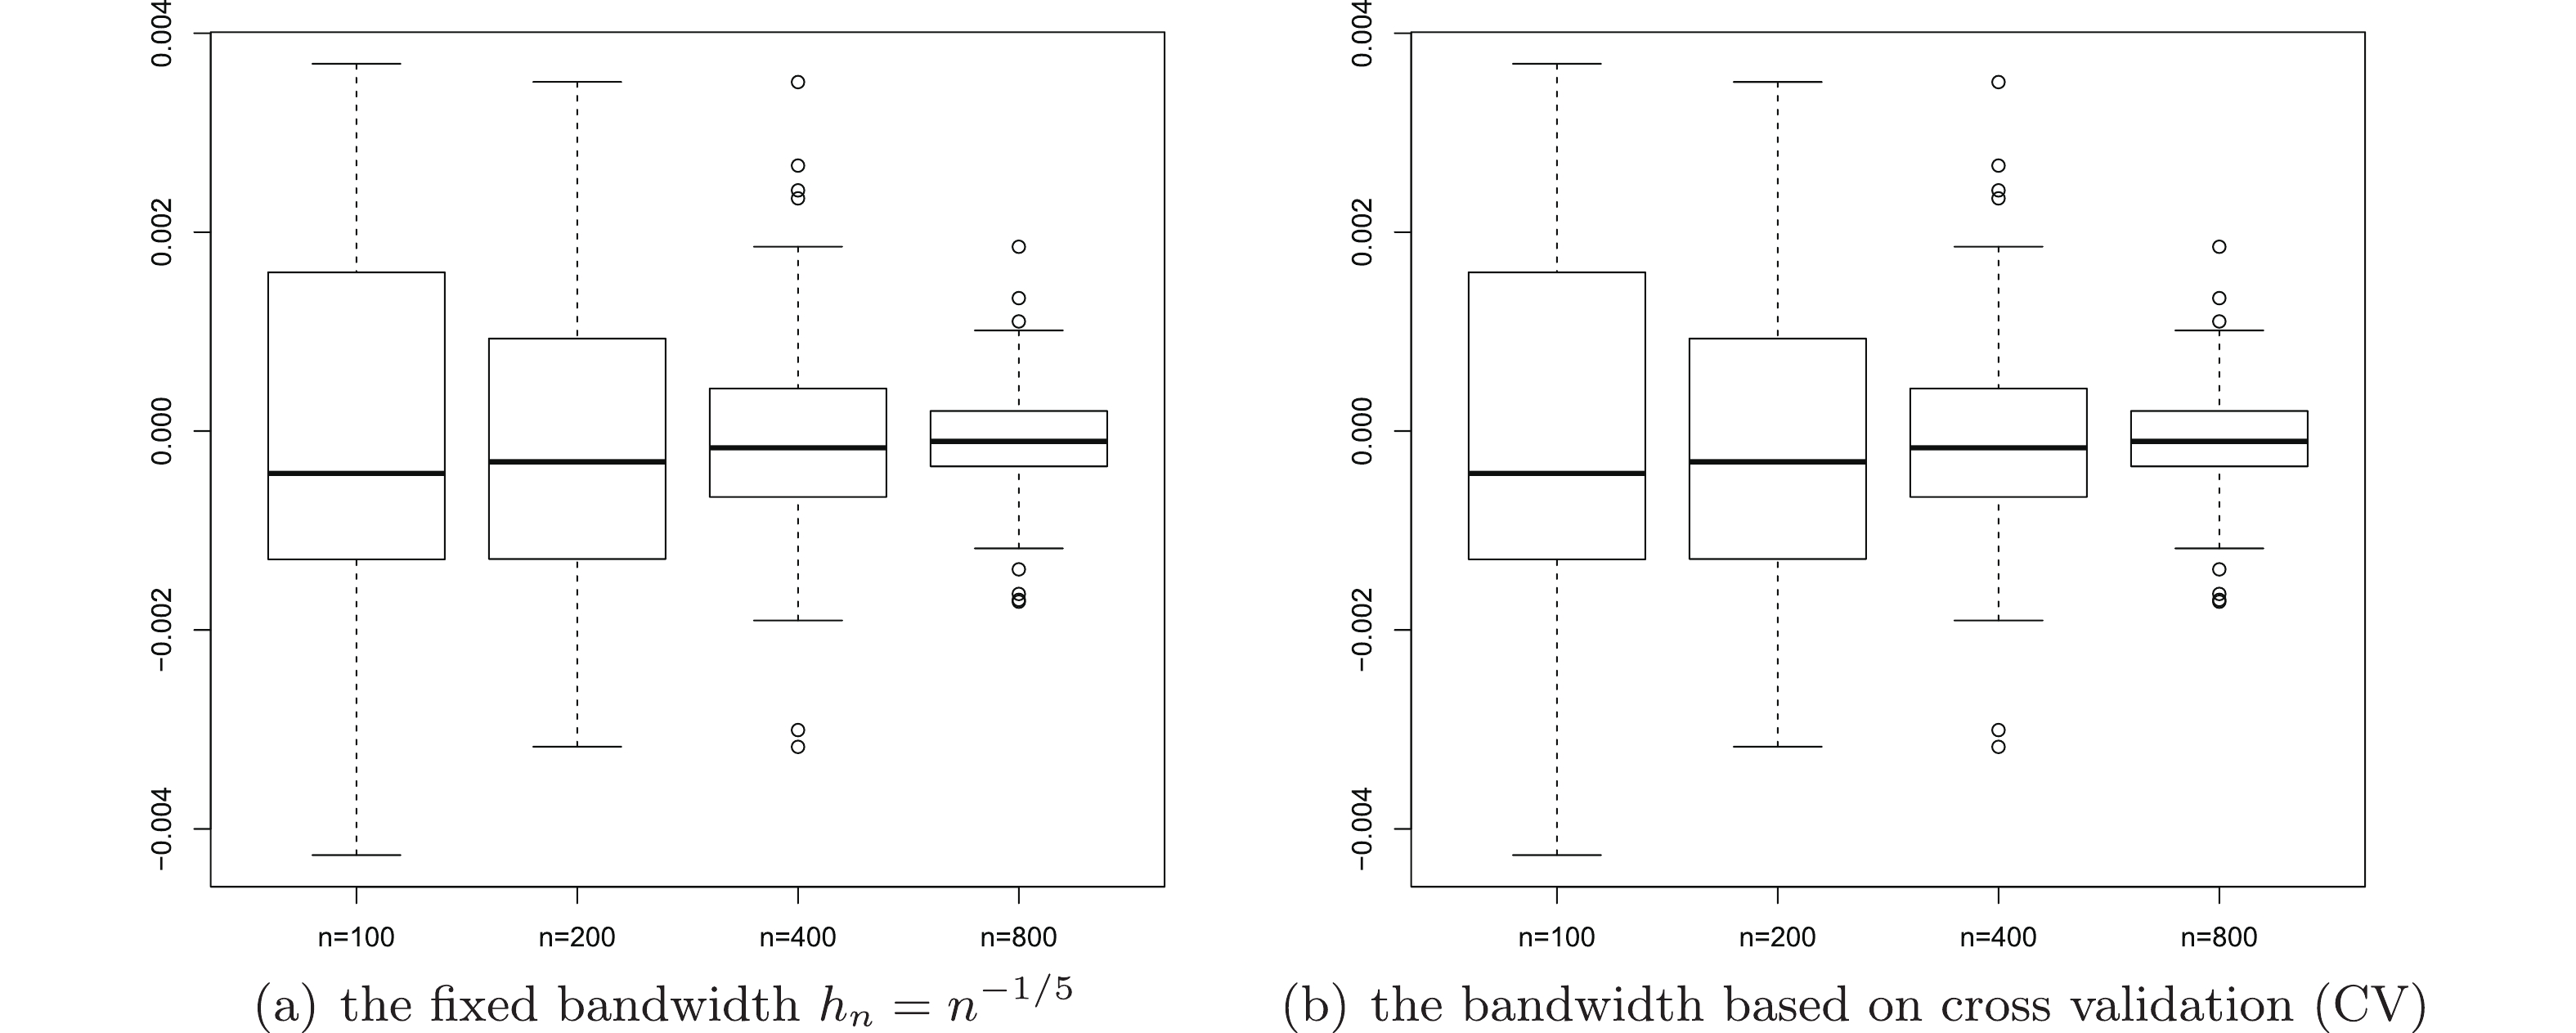
![]() Boxplot of
Boxplot of ˆfn(x)−f(x) forn=100,200,400,800 . -
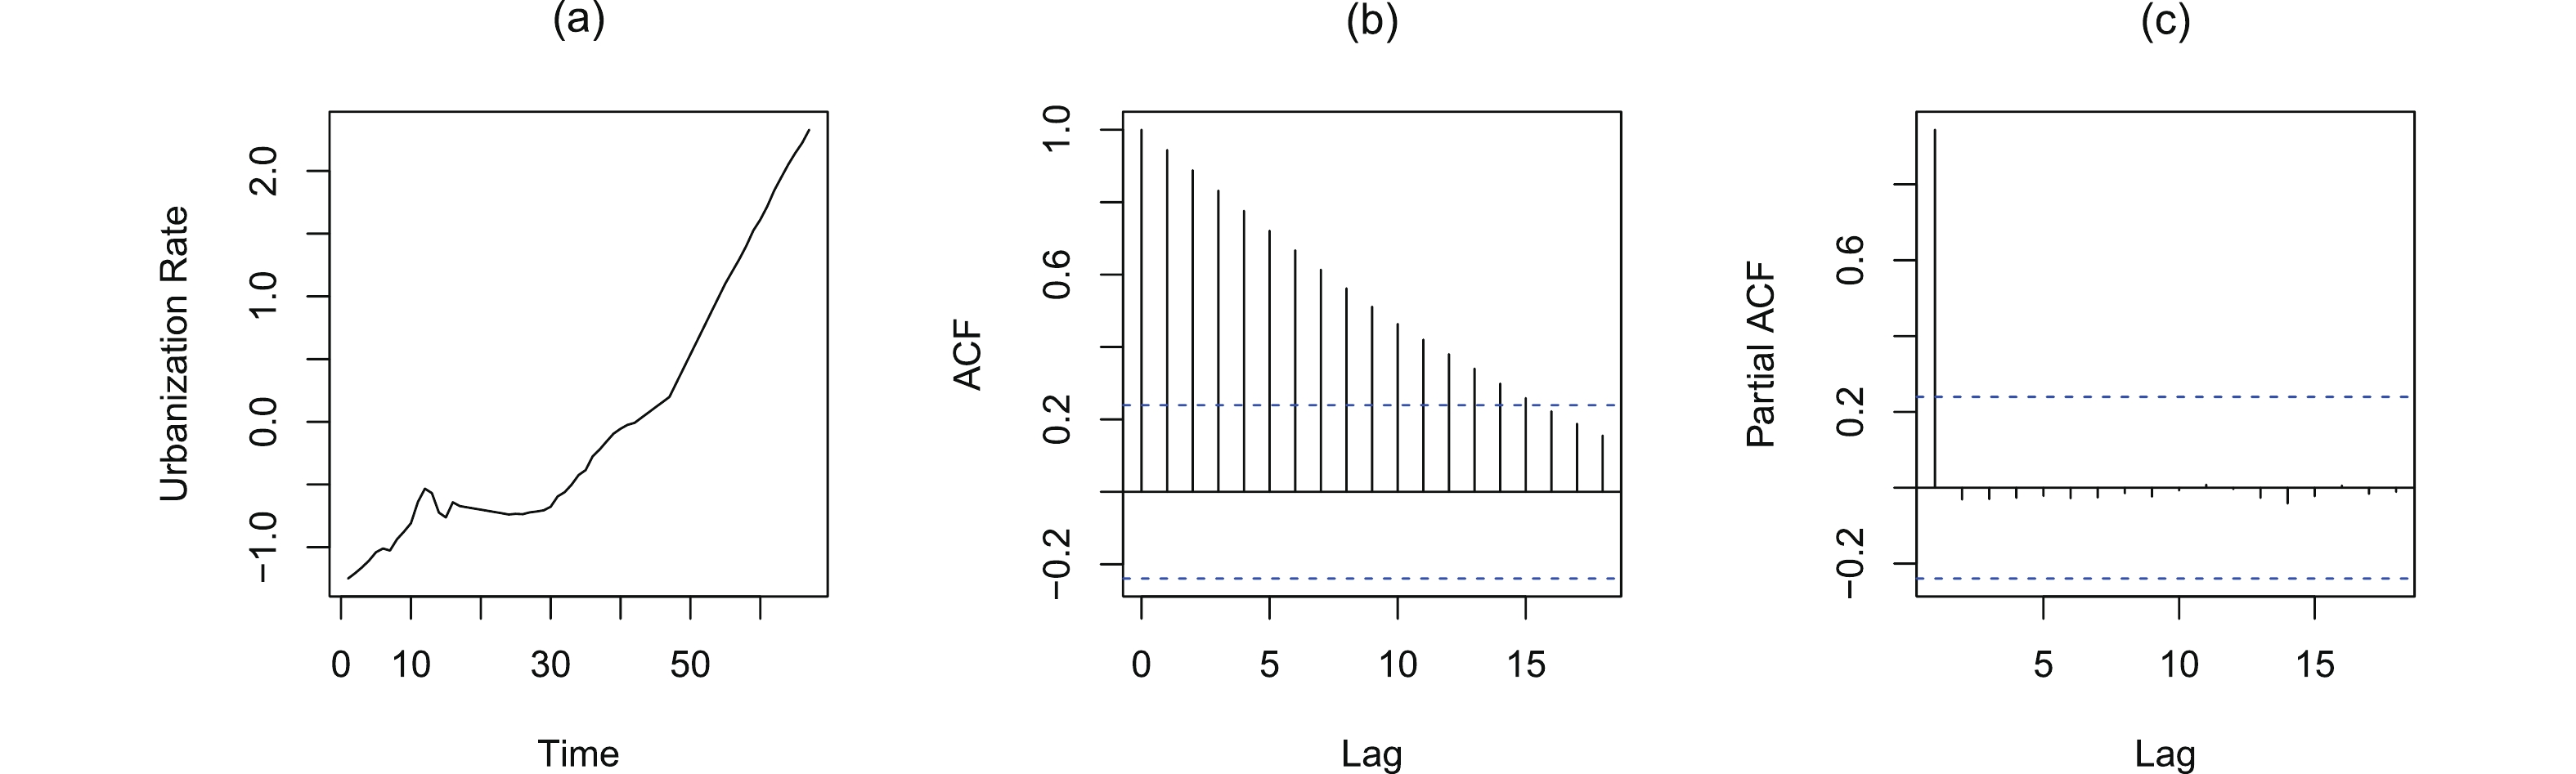
![]() (a) Urbanization rate yearly series; (b) Autocorrelation function; (c) Partial autocorrelation function.
(a) Urbanization rate yearly series; (b) Autocorrelation function; (c) Partial autocorrelation function.
-
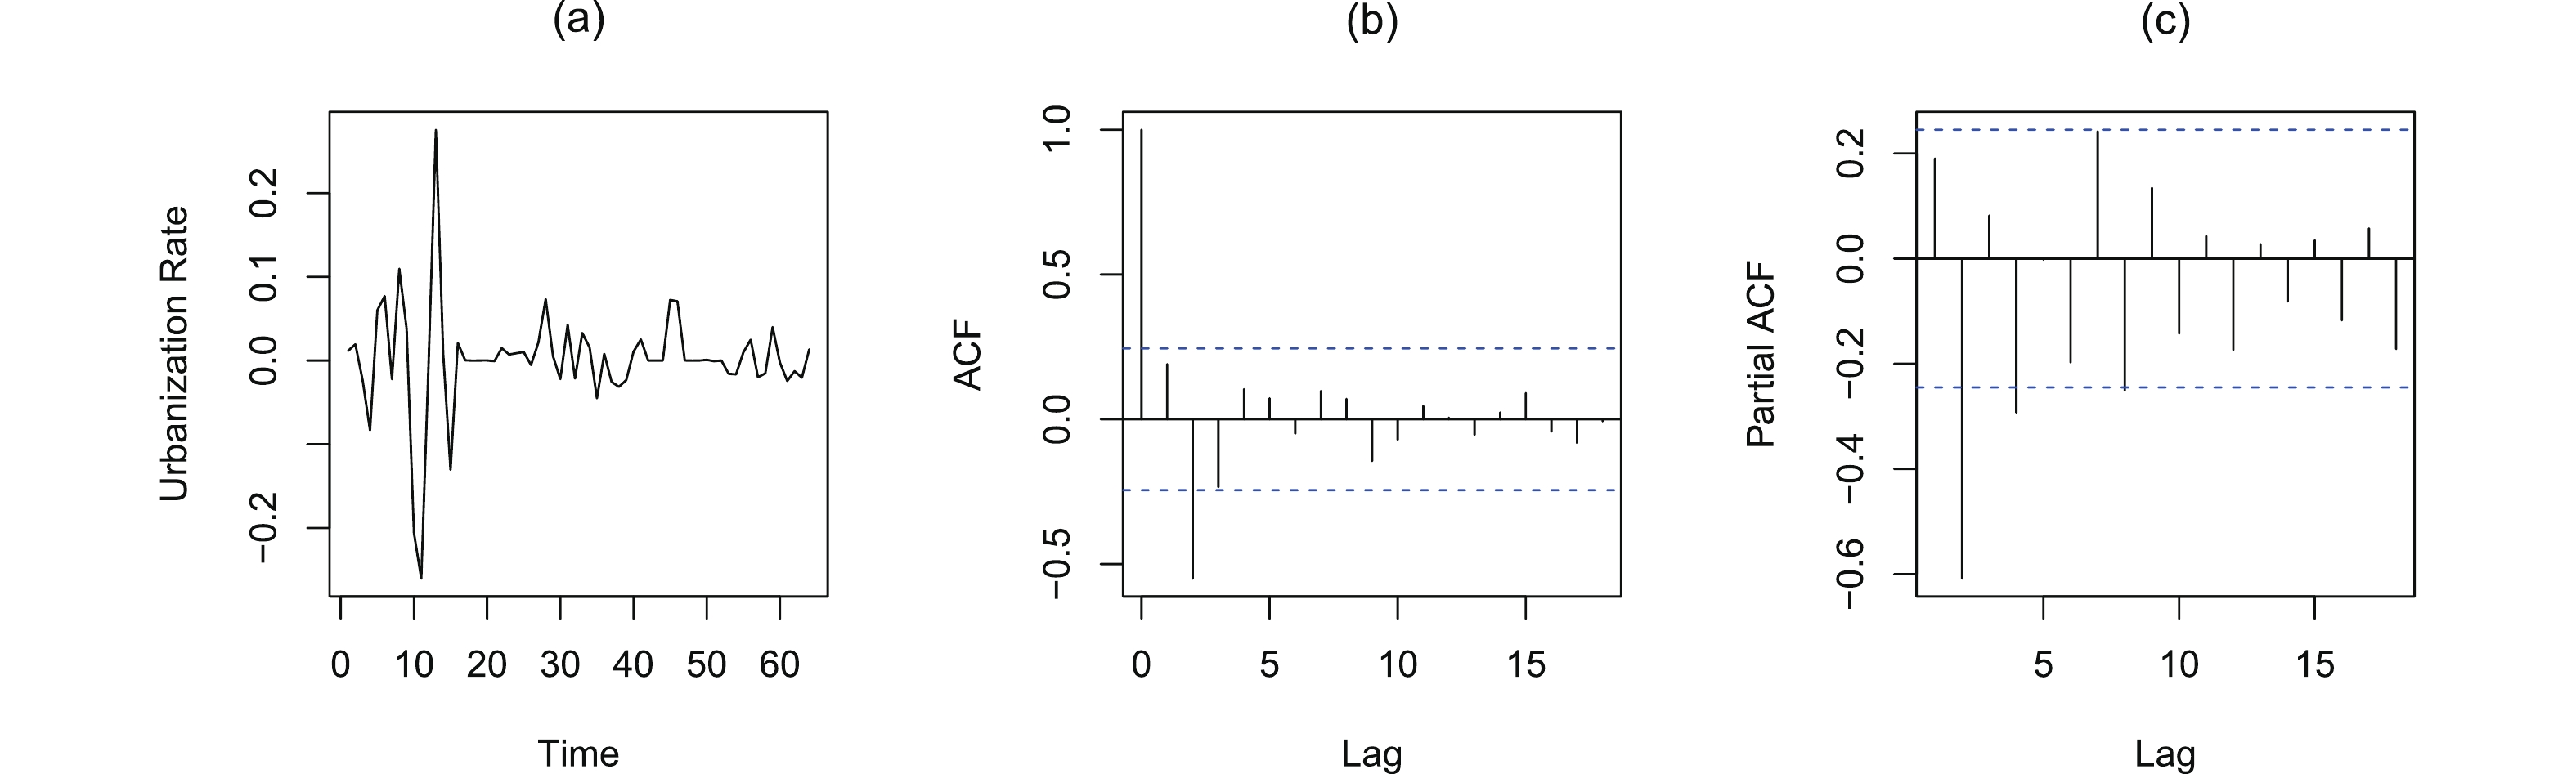
![]() (a) Differences of urbanization rate yearly series; (b) Autocorrelation function; (c) Partial autocorrelation function.
(a) Differences of urbanization rate yearly series; (b) Autocorrelation function; (c) Partial autocorrelation function.
-
![]() Comparison of
Comparison of ˆfn(x) andf(x) for different bandwidths.


Related articles
-
2022, 52(9): 6-1-6-9. DOI: 10.52396/JUSTC-2021-0155
-
2021, 51(10): 717-724. DOI: 10.52396/JUST-2020-0032
-
2020, 50(7): 977-984. DOI: 10.3969/j.issn.0253-2778.2020.07.015
-
2020, 50(6): 793-800. DOI: 10.3969/j.issn.0253-2778.2020.06.011
-
2020, 50(5): 637-644. DOI: 10.3969/j.issn.0253-2778.2020.05.011
-
2018, 48(10): 825-837. DOI: 10.3969/j.issn.0253-2778.2018.10.009
-
2018, 48(10): 781-784. DOI: 10.3969/j.issn.0253-2778.2018.10.002
-
2016, 46(8): 665-670. DOI: 10.3969/j.issn.0253-2778.2016.08.007
-
2014, 44(4): 292-302. DOI: 10.3969/j.issn.0253-2778.2014.04.006
-
2008, 38(8): 905-908.
