
 Download:
Figures of the Article
-
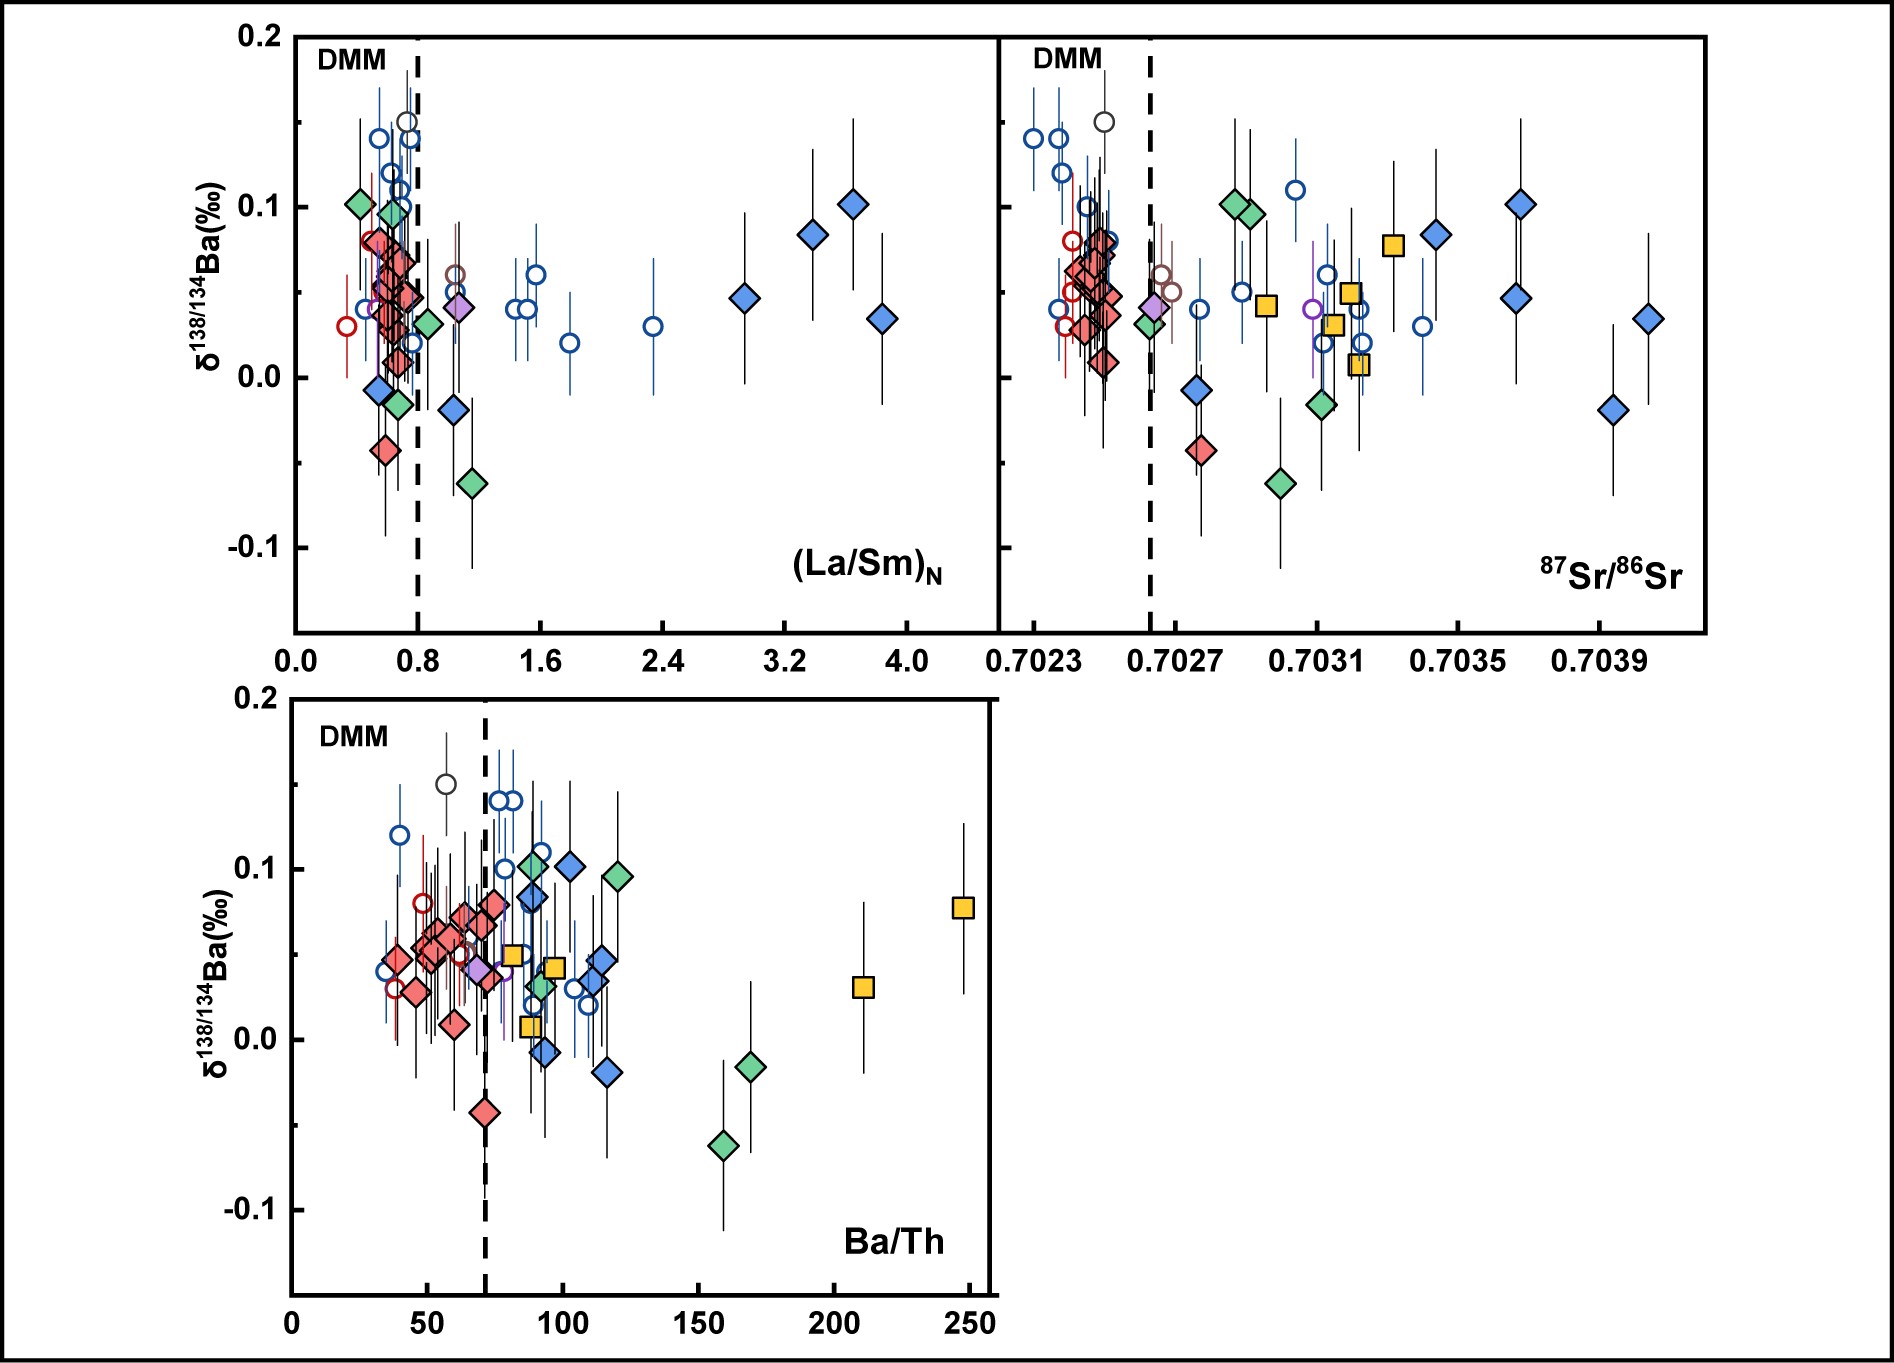
![]() Correlations between δ138/134Ba and (a) (La/Sm)N, (b) 87Sr/86Sr, and (c) Ba/Th for the mid-ocean ridge basalt (MORB) and back-arc basin basalt (BABB) samples in our study and MORB samples analyzed by Nielsen et al.[7]. Data are from Table 1. Error bars represent 2SD uncertainties. The vertical dotted lines present the defined average (La/Sm)N[16], 87Sr/86Sr[28], and Ba/Th[28] of the depleted MORB mantle. Samples in the orange shade are marked as depleted MORB, and those in the blue shade are marked as normal-type MORB or enriched-type MORB.
Correlations between δ138/134Ba and (a) (La/Sm)N, (b) 87Sr/86Sr, and (c) Ba/Th for the mid-ocean ridge basalt (MORB) and back-arc basin basalt (BABB) samples in our study and MORB samples analyzed by Nielsen et al.[7]. Data are from Table 1. Error bars represent 2SD uncertainties. The vertical dotted lines present the defined average (La/Sm)N[16], 87Sr/86Sr[28], and Ba/Th[28] of the depleted MORB mantle. Samples in the orange shade are marked as depleted MORB, and those in the blue shade are marked as normal-type MORB or enriched-type MORB.
-
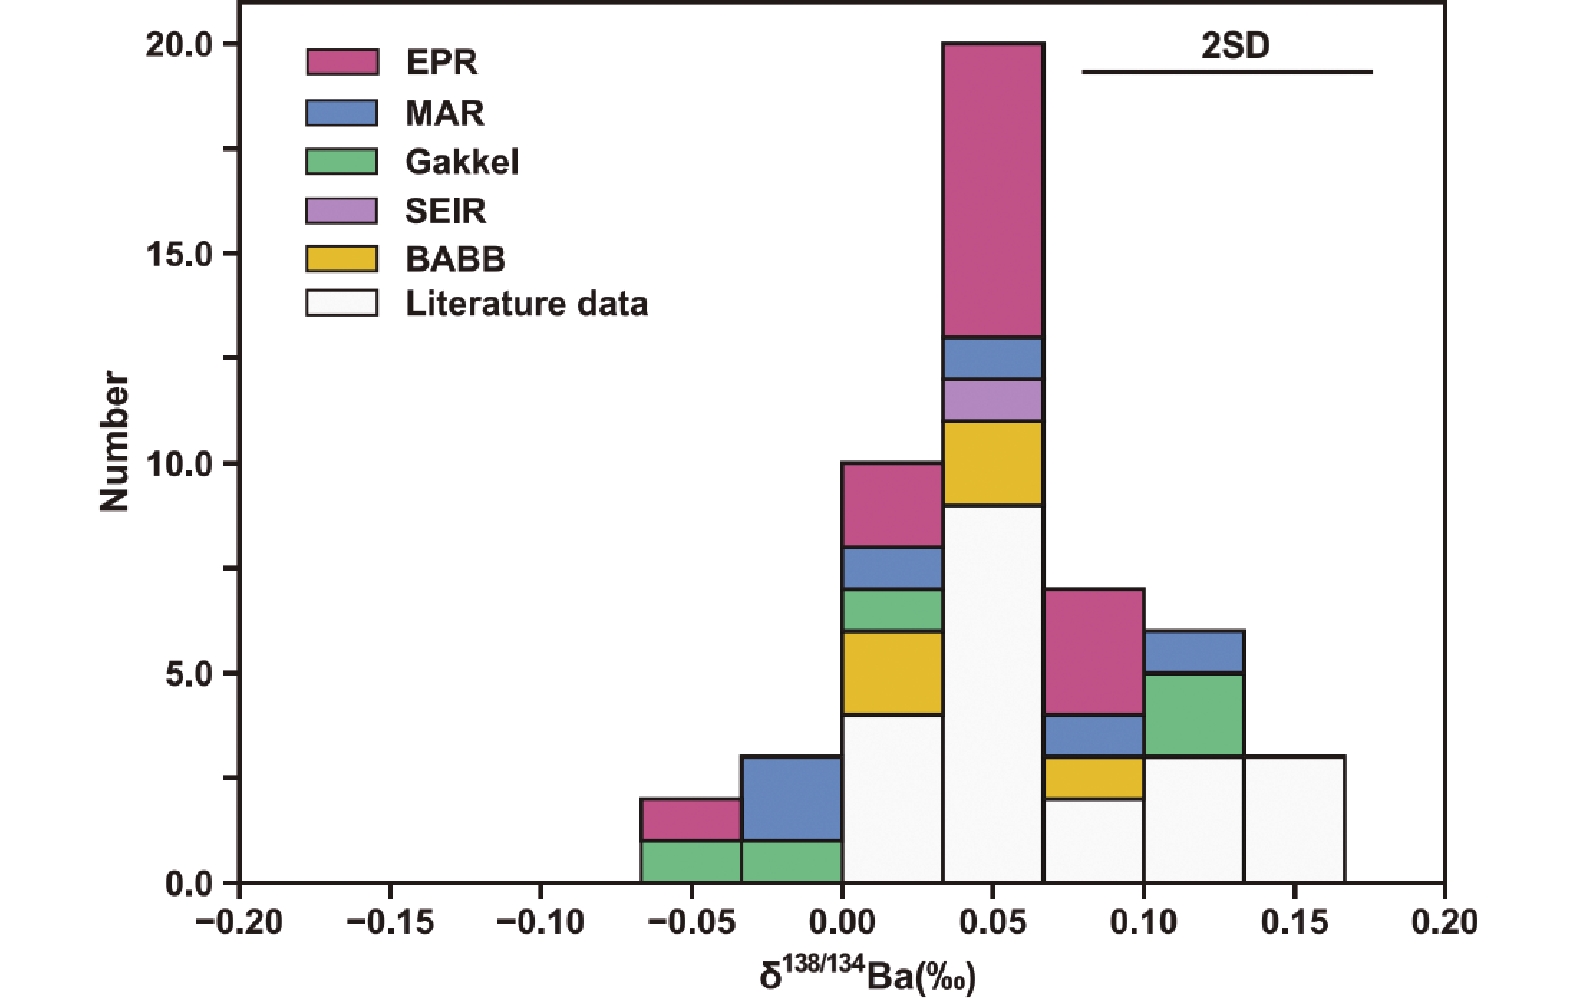
![]() The histogram of Ba isotope compositions of MORBs and BABBs investigated in this study. Literature data of MORBs are from Nielsen et al.[7]. Data are from Table 1.
The histogram of Ba isotope compositions of MORBs and BABBs investigated in this study. Literature data of MORBs are from Nielsen et al.[7]. Data are from Table 1.
-
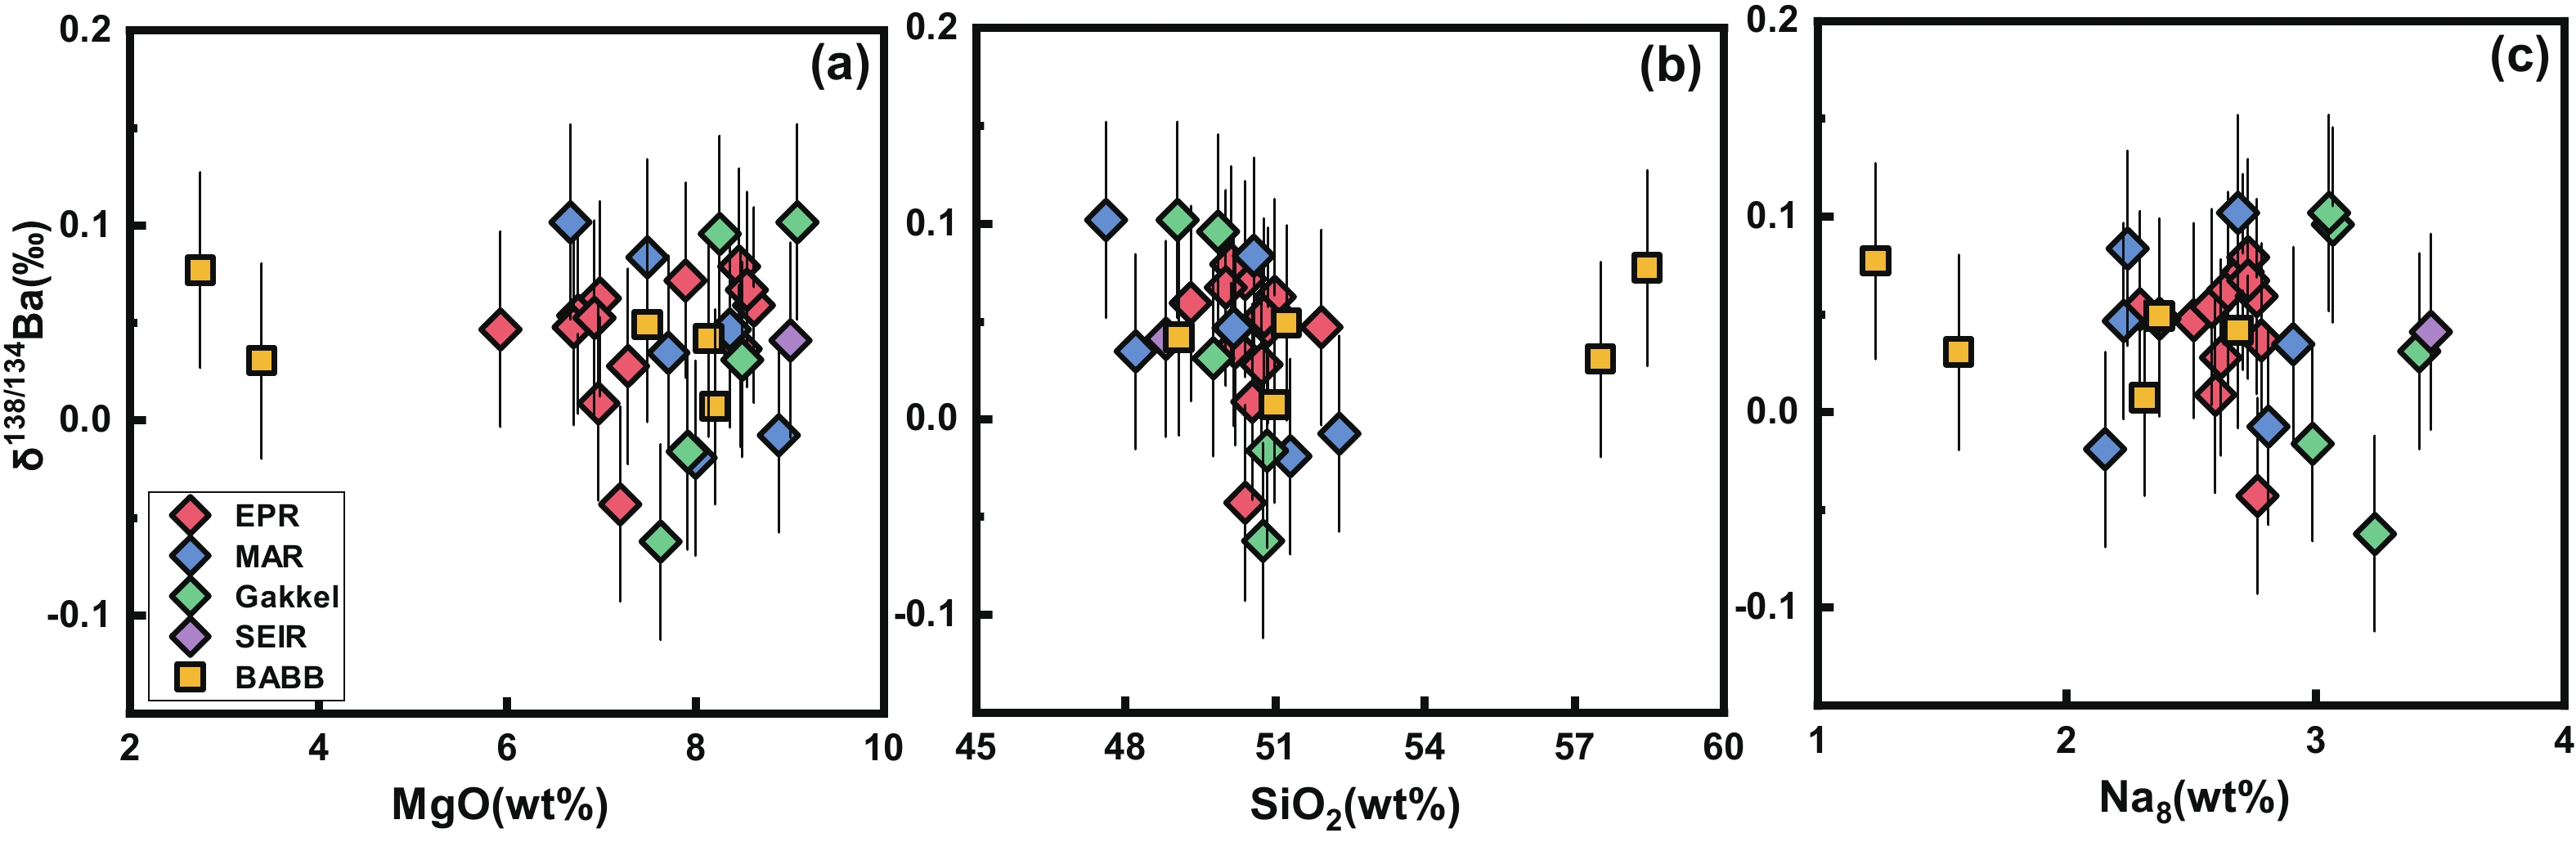
![]() δ138/134Ba versus (a) MgO, (b) SiO2 and (c) Na8 for MORBs and BABBs. Na8 = Na2O + 0.373 × MgO − 2.98 (from Ref. [27]). Data are from Table 1. The error bars represent the 2SD uncertainties.
δ138/134Ba versus (a) MgO, (b) SiO2 and (c) Na8 for MORBs and BABBs. Na8 = Na2O + 0.373 × MgO − 2.98 (from Ref. [27]). Data are from Table 1. The error bars represent the 2SD uncertainties.

Related articles
-
2024, 54(8): 0803. DOI: 10.52396/JUSTC-2023-0163
-
2022, 52(3): 6-1-6-8. DOI: 10.52396/JUSTC-2021-0217
-
2020, 50(3): 312-316. DOI: 10.3969/j.issn.0253-2778.2020.03.008
-
2019, 49(3): 199-202. DOI: 10.3969/j.issn.0253-2778.2019.03.004
-
2017, 47(6): 459-464. DOI: 10.3969/j.issn.0253-2778.2017.06.002
-
2017, 47(6): 455-458. DOI: 10.3969/j.issn.0253-2778.2017.06.001
-
2016, 46(8): 625-628. DOI: 10.3969/j.issn.0253-2778.2016.08.001
-
2015, 45(12): 1015. DOI: 10.3969/j.issn.0253-2778.2015.12.008
-
2015, 45(6): 431-435. DOI: 10.3969/j.issn.0253-2778.2015.06.001
-
2011, 41(5): 377-383. DOI: 10.3969/j.issn.0253-2778.2011.05.001
