

Figure
1.
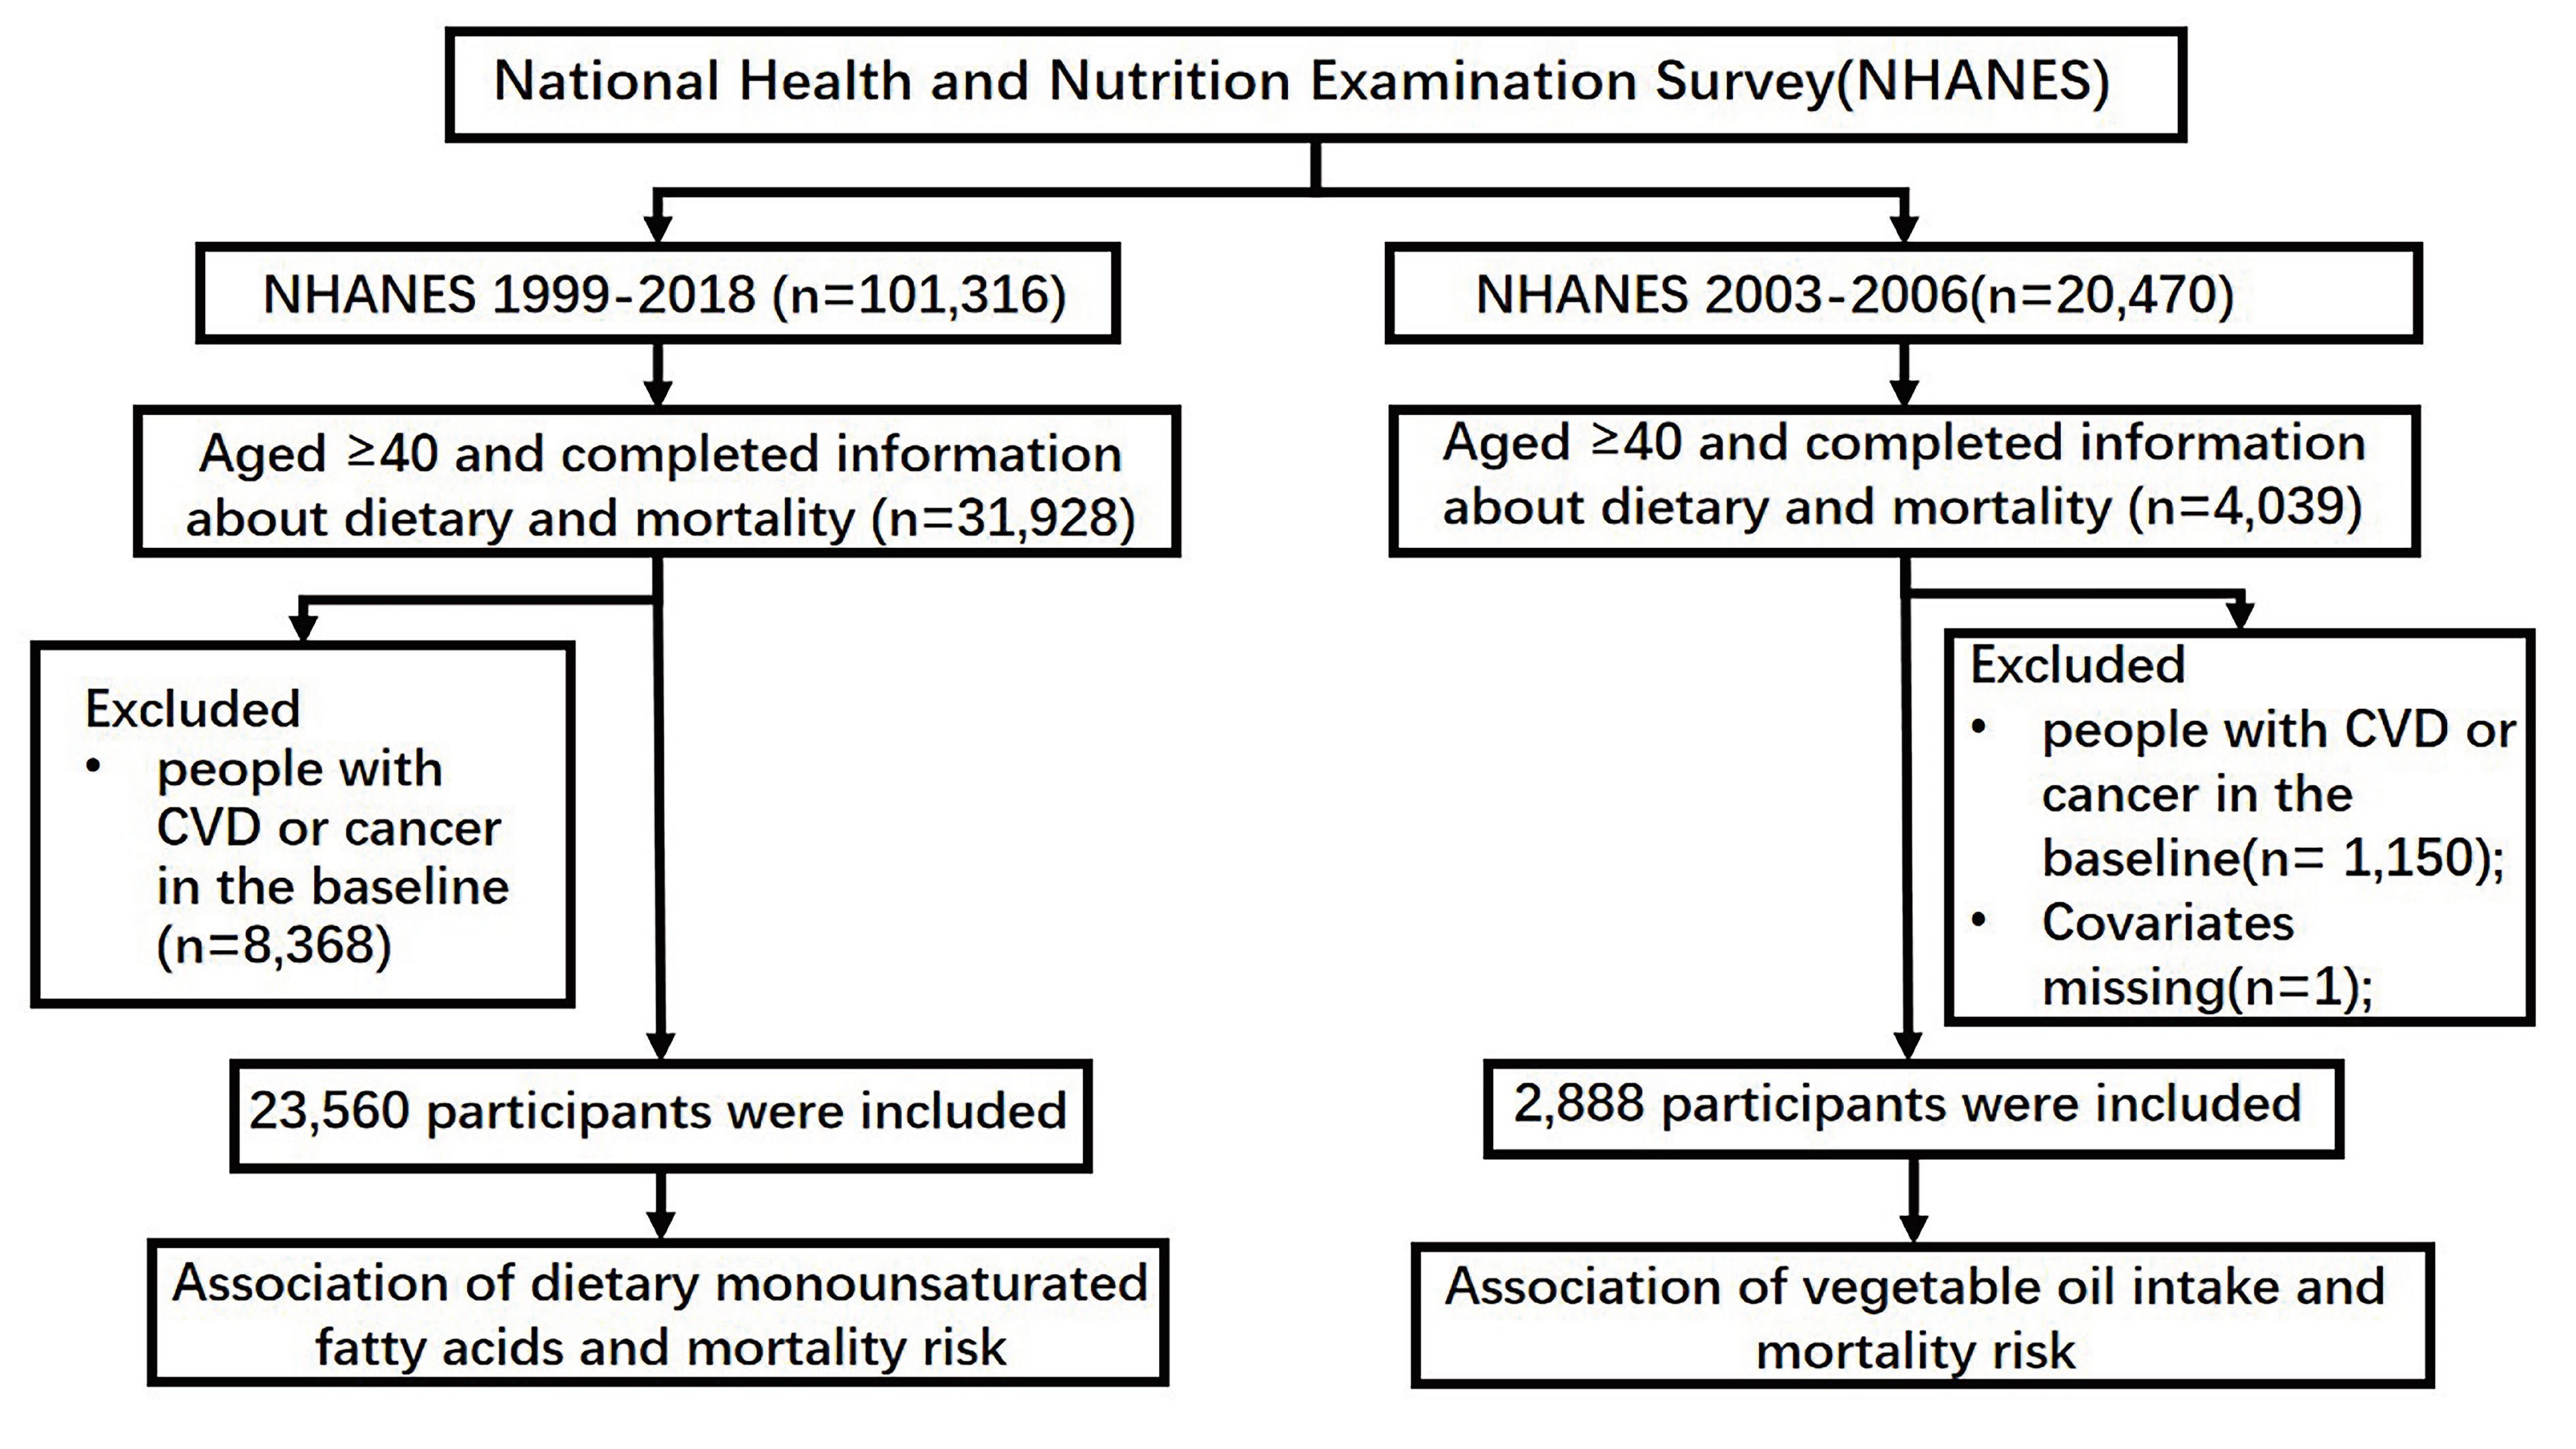
Flow chart of participant selection.
Objective: Oleic acid, a subtype of monounsaturated fatty acid (MUFA), is present in abundance in certain edible oils, particularly olive oils. Epidemiological evidence concerning dietary oleic acid intake and the long-term risk of mortality is lacking. This study aimed to evaluate the associations of the dietary intake of oleic acid and other specific subtypes of MUFAs, olive oil, and other vegetable oils with cardiovascular disease (CVD) and all-cause mortality. Methods: This prospective cohort study included adults aged 40 years or older who participated in the included U.S. adults National Health and Nutrition Examination Survey (NHANES). Dietary MUFA intake was assessed via 24-h dietary recall interviews in NHANES 1999–2018, and the consumption of olive oil and other vegetable oils was assessed via a food frequency questionnaire in NHANES 2003–2006. Deaths and underlying causes of death were ascertained by linkage to the National Death Index through December 31, 2019. Weighted Cox proportional hazards regression models were used to estimate the hazard ratio (HR) and 95% CIs. Results: Dietary intake of total MUFAs and oleic acid was associated with a lower risk of CVD mortality, with HRs (95% CI) of 0.62 (0.39–0.99) and 0.61 (0.39–0.97), respectively. Total MUFA and oleic acid intake were inversely associated with all-cause mortality; the multivariable-adjusted HRs were 0.77 (95% CI: 0.60–0.99) and 0.78 (95% CI: 0.62–0.99), respectively. There was no significant association between palmitoleic acid intake and all-cause mortality. The habitual consumption of olive oil, but not the consumption of other vegetable oils, was inversely associated with the risk of cardiovascular mortality. In the joint association analysis, the HRs (95% CI) of cardiovascular mortality were 0.36 (0.19–0.69) for people who exclusively consumed olive oil, 0.59 (0.27–1.32) for people who consumed both olive oil and other vegetable oils, and 0.73 (0.46–1.14) for people who exclusively consumed other vegetable oils compared with people who never consumed vegetable oils. Conclusions: In a U.S. nationally representative prospective cohort, higher dietary oleic acid intake and olive oil consumption were associated with a lower risk of cardiovascular mortality.
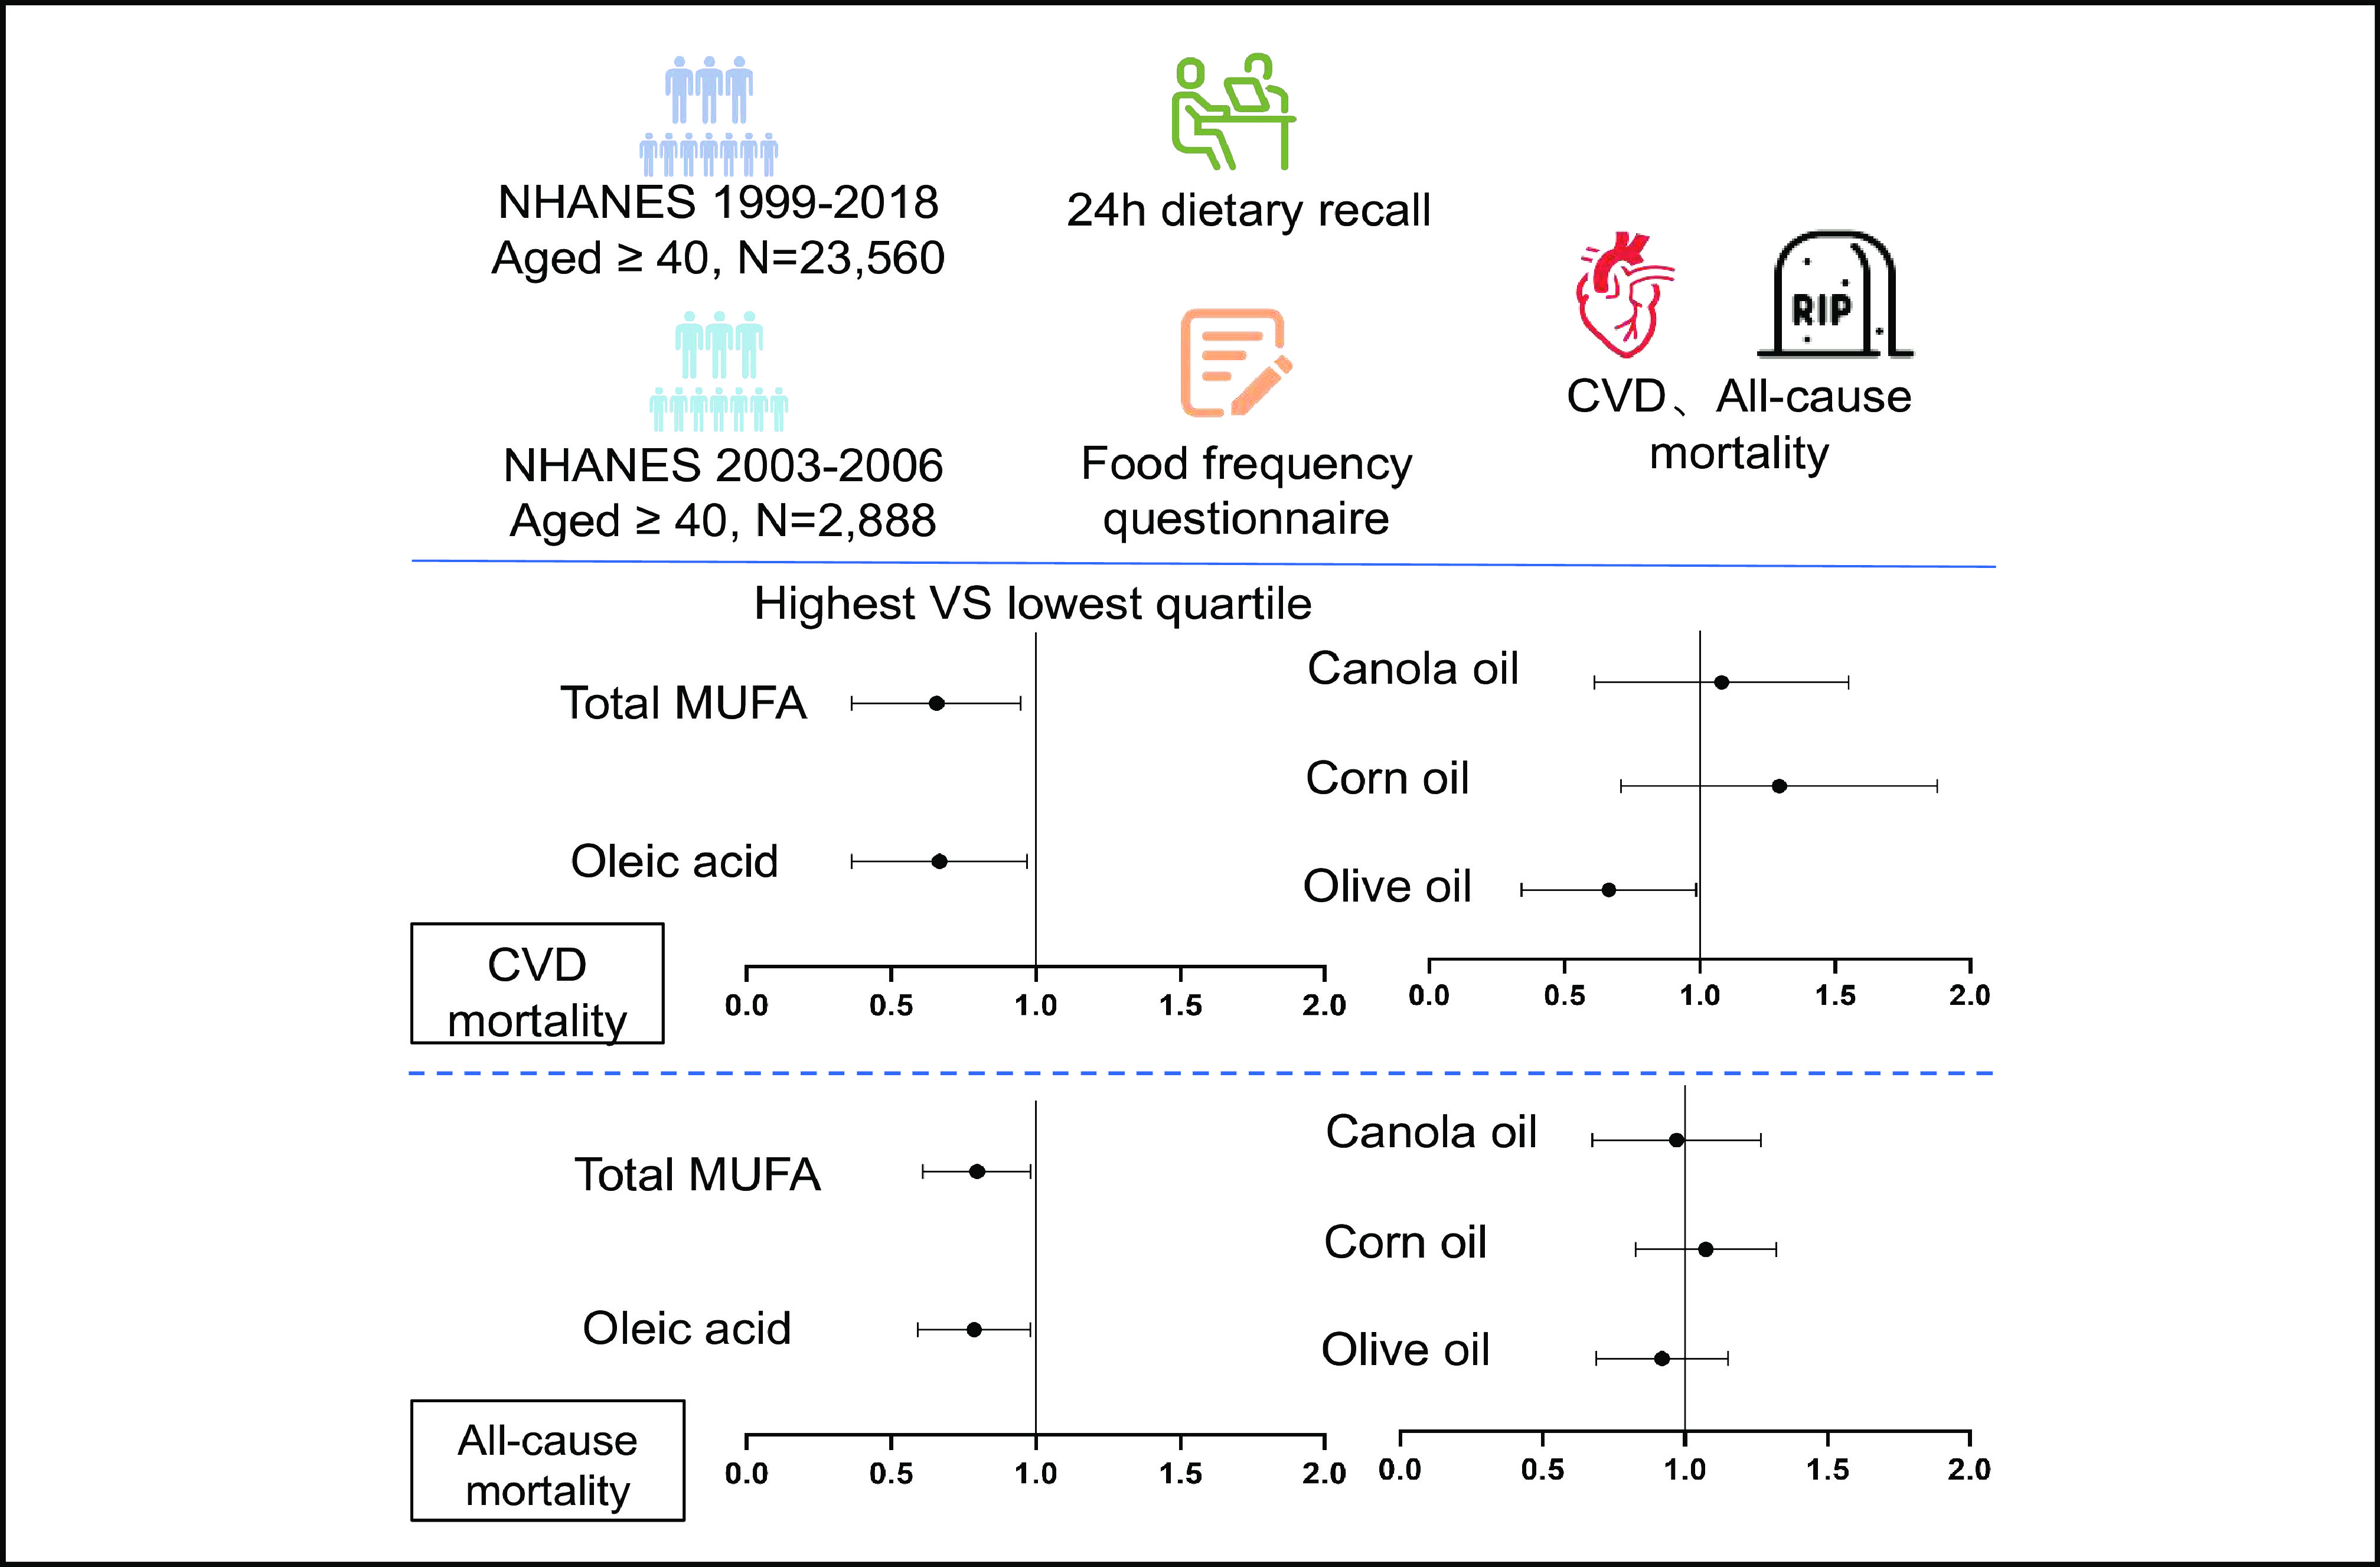
Study design chart and adjusted HRs (95% CIs) for the associations between the dietary intake of oleic acid and the consumption of other specific subtypes of MUFAs, olive oil, and other vegetable oils and CVD and all-cause mortality.
Figure
1.
| [1] |
World Health Organization. Cardiovascular diseases (CVDs). 2021 . https://www.who.int/news-room/fact-sheets/detail/cardiovascular-diseases-(cvds). Accessed December 8, 2023.
|
| [2] |
Pallazola V A, Davis D M, Whelton S P, et al. A clinician’s guide to healthy eating for cardiovascular disease prevention. Mayo Clinic Proceedings:Innovations, Quality & Outcomes, 2019, 3 (3): 251–267. DOI: 10.1016/j.mayocpiqo.2019.05.001
|
| [3] |
U. S. Department of Health and Human Services, and U.S. Department of Agriculture. Dietary Guidelines for Americans, 2020-2025. 2020 . https://odphp.health.gov/our-work/nutrition-physical-activity/dietary-guidelines/current-dietary-guidelines. Accessed December 8, 2023.
|
| [4] |
Buckland G, Mayén A L, Agudo A, et al. Olive oil intake and mortality within the Spanish population (EPIC-Spain). The American Journal of Clinical Nutrition, 2012, 96 (1): 142–149. DOI: 10.3945/ajcn.111.024216
|
| [5] |
Guasch-Ferré M, Hu F B, Martínez-González M A, et al. Olive oil intake and risk of cardiovascular disease and mortality in the PREDIMED Study. BMC Medicine, 2014, 12: 78. DOI: 10.1186/1741-7015-12-78
|
| [6] |
Estruch R, Ros E, Salas-Salvadó J, et al. Primary prevention of cardiovascular disease with a Mediterranean diet supplemented with extra-virgin olive oil or nuts. The New England Journal of Medicine, 2018, 378 (25): e34. DOI: 10.1056/NEJMoa1800389
|
| [7] |
Guasch-Ferré M, Li Y, Willett W C, et al. Consumption of olive oil and risk of total and cause-specific mortality among U.S. adults. Journal of the American College of Cardiology, 2022, 79 (2): 101–112. DOI: 10.1016/j.jacc.2021.10.041
|
| [8] |
National Center For Health Statistics. The Linkage of National Center for Health Statistics Survey Data to the National Death Index– 2019 Linked Mortality File (LMF): Linkage Methodology and Analytic Considerations. 2021 . https://www.cdc.gov/nchs/data/datalinkage/2019NDI-Linkage-Methods-and-Analytic-Considerations-508.pdf. Accessed December 8, 2023.
|
| [9] |
World Health Organization. ICD-10 : international statistical classification of diseases and related health problems : tenth revision, 2nd ed. World Health Organization, 2004 . https://iris.who.int/handle/10665/42980. Accessed December 8, 2023.
|
| [10] |
U.S. Department of Agriculture. USDA Automated Multiple-Pass Method for Dietary Recalls. 2021 . https://www.ars.usda.gov/northeast-area/beltsville-md-bhnrc/beltsville-human-nutrition-research-center/food-surveys-research-group/docs/main-service-page/. Accessed December 8, 2023.
|
| [11] |
National Health And Nutrition Examination Survey. 2003–2004 Data Documentation, Codebook, and Frequencies: Food Frequency Questionnaire - Raw Questionnaire Responses. 2008 . https://wwwn.cdc.gov/Nchs/Nhanes/2003-2004/FFQRAW_C.htm. Accessed December 8, 2023.
|
| [12] |
Johnson C L, Paulose-Ram R, Ogden C L, et al. National health and nutrition examination survey: analytic guidelines, 1999-2010. In:Vital and Health Statistics:Series 2. National Center for Health Statistics, 2013 .
|
| [13] |
U. S. Department of Health and Human Services. 2008 Physical Activity Guidelines for Americans. 2008 . https://health.gov/sites/default/files/2019-09/paguide.pdf. Accessed December 8, 2023.
|
| [14] |
Krebs-Smith S M, Pannucci T E, Subar A F, et al. Update of the healthy eating index: HEI-2015. Journal of the Academy of Nutrition and Dietetics, 2018, 118 (9): 1591–1602. DOI: 10.1016/j.jand.2018.05.021
|
| [15] |
Mazidi M, Mikhailidis D P, Sattar N, et al. Association of types of dietary fats and all-cause and cause-specific mortality: A prospective cohort study and meta-analysis of prospective studies with 1,164,029 participants. Clinical Nutrition, 2020, 39 (12): 3677–3686. DOI: 10.1016/j.clnu.2020.03.028
|
| [16] |
Yao X L, Xu X, Wang S, et al. Associations of dietary fat intake with mortality from all causes, cardiovascular disease, and cancer: A prospective study. Frontiers in Nutrition, 2021, 8: 701430. DOI: 10.3389/fnut.2021.701430
|
| [17] |
Guasch-Ferré M, Babio N, Martínez-González M A, et al. Dietary fat intake and risk of cardiovascular disease and all-cause mortality in a population at high risk of cardiovascular disease. The American Journal of Clinical Nutrition, 2015, 102 (6): 1563–1573. DOI: 10.3945/ajcn.115.116046
|
| [18] |
Zhang Y L, Jing L L, Xu X, et al. Dietary fatty acids intake and all-cause and cardiovascular mortality in patients on peritoneal dialysis. Clinical Nutrition, 2023, 42 (11): 2188–2197. DOI: 10.1016/j.clnu.2023.09.002
|
| [19] |
Lotfi K, Salari-Moghaddam A, Yousefinia M, et al. Dietary intakes of monounsaturated fatty acids and risk of mortality from all causes, cardiovascular disease and cancer: A systematic review and dose-response meta-analysis of prospective cohort studies. Ageing Research Reviews, 2021, 72: 101467. DOI: 10.1016/j.arr.2021.101467
|
| [20] |
Schwingshackl L, Hoffmann G. Monounsaturated fatty acids, olive oil and health status: a systematic review and meta-analysis of cohort studies. Lipids in Health and Disease, 2014, 13: 154. DOI: 10.1186/1476-511X-13-154
|
| [21] |
Bermúdez M A, Pereira L, Fraile C, et al. Roles of palmitoleic acid and its positional isomers, hypogeic and sapienic acids, in inflammation, metabolic diseases and cancer. Cells, 2022, 11 (14): 2146. DOI: 10.3390/cells11142146
|
| [22] |
Garg M L, Blake R J, Wills R B. Macadamia nut consumption lowers plasma total and LDL cholesterol levels in hypercholesterolemic men. The Journal of Nutrition, 2003, 133 (4): 1060–1063. DOI: 10.1093/jn/133.4.1060
|
| [23] |
Griel A E, Cao Y, Bagshaw D D, et al. A macadamia nut-rich diet reduces total and LDL-cholesterol in mildly hypercholesterolemic men and women. The Journal of Nutrition, 2008, 138 (4): 761–767. DOI: 10.1093/jn/138.4.761
|
| [24] |
Mozaffarian D, Cao H, King I B, et al. Circulating palmitoleic acid and risk of metabolic abnormalities and new-onset diabetes. The American Journal of Clinical Nutrition, 2010, 92 (6): 1350–1358. DOI: 10.3945/ajcn.110.003970
|
| [25] |
Kim D S, Maden S K, Burt A A, et al. Dietary fatty acid intake is associated with paraoxonase 1 activity in a cohort-based analysis of 1,548 subjects. Lipids in Health and Disease, 2013, 12: 183. DOI: 10.1186/1476-511X-12-183
|
| [26] |
Bremer J, Norum K R. Metabolism of very long-chain monounsaturated fatty acids (22: 1) and the adaptation to their presence in the diet. Journal of Lipid Research, 1982, 23 (2): 243–256. DOI: 10.1016/S0022-2275(20)38153-0
|
| [27] |
Zhang Y, Zhuang P, Wu F, et al. Cooking oil/fat consumption and deaths from cardiometabolic diseases and other causes: prospective analysis of 521, 120 individuals. BMC Medicine, 2021, 19: 92. DOI: 10.1186/s12916-021-01961-2
|
| [28] |
Schwingshackl L, Christoph M, Hoffmann G. Effects of olive oil on markers of inflammation and endothelial function—A systematic review and meta-analysis. Nutrients, 2015, 7 (9): 7651–7675. DOI: 10.3390/nu7095356
|
| [29] |
Wang Q, Liu R J, Chang M, et al. Dietary oleic acid supplementation and blood inflammatory markers: a systematic review and meta-analysis of randomized controlled trials. Critical Reviews in Food Science and Nutrition, 2022, 62 (9): 2508–2525. DOI: 10.1080/10408398.2020.1854673
|
| [30] |
Hernáez Á, Remaley A T, Farràs M, et al. Olive oil polyphenols decrease LDL concentrations and LDL atherogenicity in men in a randomized controlled trial. The Journal of Nutrition, 2015, 145 (8): 1692–1697. DOI: 10.3945/jn.115.211557
|
| [31] |
Fernández-Castillejo S, Valls R M, Castañer O, et al. Polyphenol rich olive oils improve lipoprotein particle atherogenic ratios and subclasses profile: A randomized, crossover, controlled trial. Molecular Nutrition & Food Research, 2016, 60 (7): 1544–1554. DOI: 10.1002/mnfr.201501068
|
| [32] |
Saibandith B, Spencer J P E, Rowland I R, et al. Olive polyphenols and the metabolic syndrome. Molecules, 2017, 22 (7): 1082. DOI: 10.3390/molecules22071082
|
| [33] |
Schwingshackl L, Lampousi A M, Portillo M P, et al. Olive oil in the prevention and management of type 2 diabetes mellitus: a systematic review and meta-analysis of cohort studies and intervention trials. Nutrition & Diabetes, 2017, 7: e262. DOI: 10.1038/nutd.2017.12
|
| [34] |
Gaforio J J, Visioli F, Alarcón-De-La-Lastra C, et al. Virgin olive oil and health: Summary of the III International Conference on Virgin Olive Oil and Health Consensus Report, JAEN (Spain) 2018. Nutrients, 2019, 11 (9): 2039. DOI: 10.3390/nu11092039
|
| [35] |
Millman J F, Okamoto S, Teruya T, et al. Extra-virgin olive oil and the gut-brain axis: influence on gut microbiota, mucosal immunity, and cardiometabolic and cognitive health. Nutrition Reviews, 2021, 79 (12): 1362–1374. DOI: 10.1093/nutrit/nuaa148
|

ISSN 0253-2778
CN 34-1054/N
Copyright © Editorial Office of JUSTC, All Rights Reserved. 皖ICP备05002528号
Supported by: Beijing Renhe Information Technology Co., Ltd. 
| Total MUFA intake | P value1 | ||||
| Q1 | Q2 | Q3 | Q4 | ||
| Number of participants | |||||
| Age (year) | 57.4 (0.2) | 56.3 (0.2) | 55.2 (0.2) | 53.0 (0.2) | <0.001 |
| Sex | |||||
| Male | 28.9 (0.9) | 35.7 (0.8) | 48.5 (1.1) | 67.6 (0.9) | <0.001 |
| Female | 71.1 (0.9) | 64.3 (0.8) | 51.5 (1.1) | 32.4 (0.9) | |
| Race/ethnicity | |||||
| Hispanic | 14.5 (1.0) | 11.9 (0.8) | 11.0 (0.8) | 10.1 (0.8) | <0.001 |
| Non-Hispanic White | 63.3 (1.5) | 71.2 (1.2) | 72.5 (1.2) | 75.0 (1.1) | |
| Non-Hispanic Black | 12.9 (1.0) | 10.4 (0.7) | 10.3 (0.6) | 10.2 (0.6) | |
| Other | 9.4 (0.7) | 6.5 (0.5) | 6.2 (0.5) | 4.6 (0.4) | |
| Education | |||||
| Less than high school | 22.6 (0.9) | 17.0 (0.7) | 15.4 (0.7) | 14.2 (0.7) | <0.001 |
| High school | 25.0 (0.9) | 23.9 (1.0) | 24.7 (0.9) | 24.8 (1.0) | |
| More than high school | 52.4 (1.2) | 59.1 (1.2) | 59.9 (1.1) | 61.0 (1.2) | |
| Ratio of family income to poverty | |||||
| < 1 | 14.3 (0.7) | 10.0 (0.5) | 9.4 (0.6) | 8.3 (0.5) | <0.001 |
| 1–1.9 | 20.6 (0.9) | 17.0 (0.7) | 17.0 (0.7) | 13.9 (0.7) | |
| 2–3.9 | 25.5 (1.0) | 25.9 (1.0) | 27.3 (1.0) | 26.4 (1.0) | |
| ≥ 4 | 39.6 (1.2) | 47.2 (1.2) | 46.2 (1.4) | 51.5 (1.3) | |
| Smoking status2 | |||||
| Never smoker | 56.0 (1.1) | 53.4 (1.1) | 53.5 (0.9) | 48.6 (1.1) | <0.001 |
| Current smoker | 18.6 (0.9) | 18.4 (0.7) | 18.4 (0.9) | 19.8 (0.7) | |
| Ever smoker | 25.3 (0.9) | 28.2 (1.0) | 28.2 (0.9) | 31.6 (1.0) | |
| Alcohol drinking status3 | |||||
| Nondrinker | 64.5 (1.0) | 61.9 (1.1) | 60.0 (1.1) | 56.6 (1.1) | <0.001 |
| Moderate drinker | 5.8 (0.4) | 5.8 (0.5) | 7.3 (0.4) | 8.2 (0.6) | |
| Heavy drinker | 12.1 (0.7) | 14.1 (0.8) | 17.0 (0.9) | 18.2 (0.8) | |
| Missing | 17.6 (0.8) | 18.2 (0.8) | 15.7 (0.7) | 17.0 (0.8) | |
| Physical activity | |||||
| < 150 (min per week) | 45.7 (1.0) | 41.8 (1.0) | 39.5 (1.1) | 35.0 (1.0) | <0.001 |
| 150–299 (min per week) | 13.4 (0.8) | 13.3 (0.6) | 11.9 (0.6) | 11.9 (0.6) | |
| ≥ 300 (min per week) | 41.0 (1.0) | 44.9 (1.0) | 48.6 (1.1) | 53.0 (0.9) | |
| Total energy intake (kcal/d) | 0.006 | ||||
| HEI-20154 (min per week) | 53.7 (0.3) | 53.1 (0.3) | 51.1 (0.3) | 50.0 (0.3) | <0.001 |
| The values are weighted means (SEs) for continuous variables or percentages (SEs) for categorical variables. 1P comparisons of covariates among different groups were performed via linear regression for continuous variables and the χ2 test for categorical variables. 2Never smoker was defined as less than 100 cigarettes; ever smoker, more than 100 cigarettes but quit smoking; current smoker, more than 100 cigarettes and still smoking. 3A nondrinker was defined as alcohol consumption of 0 g/d. A moderate drinker was defined as having alcohol consumption of 0.1–28 g/d for males and 0.1–14 g/d for females. A heavy drinker was defined as alcohol consumption ≥28 g/d for males and ≥14 g/d for females. 4HEI-2015 = Healthy Eating Index-2015 |
|||||
 DownLoad:
CSV
DownLoad:
CSV
| Quartiles of different dietary MUFA intake | P value for trend | ||||
| Q1 | Q2 | Q3 | Q4 | ||
| Total MUFA | |||||
| Median intake (g/d) | 11.13 | 20.12 | 29.72 | 46.65 | |
| Deaths/person-years | 370/ |
300/ |
274/ |
191/ |
|
| Model 1 | 1.00 (Ref.) | 0.81 (0.64−1.01) | 0.86 (0.69−1.07) | 0.76 (0.56−1.02) | 0.08 |
| Model 2 | 1.00 (Ref.) | 0.77 (0.59−1.01) | 0.77 (0.55−1.09) | 0.62 (0.38−1.00) | 0.05 |
| Model 3 | 1.00 (Ref.) | 0.78 (0.60−1.01) | 0.77 (0.55−1.07) | 0.62 (0.39−0.99) | 0.047 |
| Palmitoleic acid | |||||
| Median intake (g/d) | 0.36 | 0.74 | 1.19 | 2.07 | |
| Deaths/person-years | 330/ |
288/ |
275/ |
242/ |
|
| Model 1 | 1.00 (Ref.) | 0.77 (0.62−0.96) | 0.81 (0.64−1.01) | 0.82 (0.62−1.07) | 0.13 |
| Model 2 | 1.00 (Ref.) | 0.76 (0.60−0.96) | 0.76 (0.53−0.98) | 0.75 (0.53−1.06) | 0.12 |
| Model 3 | 1.00 (Ref.) | 0.77 (0.61−0.97) | 0.75 (0.58−0.97) | 0.74 (0.52−1.04) | 0.09 |
| Oleic acid | |||||
| Median intake (g/d) | 10.27 | 18.72 | 27.69 | 43.59 | |
| Deaths/person-years | 364/ |
304/ |
279/ |
188/ |
|
| Model 1 | 1.00 (Ref.) | 0.88 (0.71−1.09) | 0.90 (0.71−1.13) | 0.75 (0.56−1.01) | 0.08 |
| Model 2 | 1.00 (Ref.) | 0.86 (0.66−1.12) | 0.82 (0.59−1.14) | 0.62 (0.39−0.97) | 0.05 |
| Model 3 | 1.00 (Ref.) | 0.86 (0.66−1.11) | 0.81 (0.58−1.12) | 0.61 (0.39−0.97) | 0.043 |
| Gadoleic acid | |||||
| Median intake (g/d) | 0.06 | 0.14 | 0.25 | 0.47 | |
| Deaths/person-years | 430/ |
290/ |
238/ |
177/ |
|
| Model 1 | 1.00 (Ref.) | 0.80 (0.65−1.00) | 0.93 (0.75−1.15) | 0.90 (0.69−1.17) | 0.40 |
| Model 2 | 1.00 (Ref.) | 0.85 (0.66−1.07) | 0.98 (0.75−1.28) | 0.99 (0.68−1.45) | 0.71 |
| Model 3 | 1.00 (Ref.) | 0.84 (0.66−1.08) | 1.00 (0.76−1.30) | 1.01 (0.69−1.48) | 0.61 |
| Erucic acid | |||||
| Median intake (g/d) | 0.00 | 0.003 | 0.01 | 0.06 | |
| Deaths/person-years | 364/ |
220/ |
277/ |
274/ |
|
| Model 1 | 1.00 (Ref.) | 0.87 (0.67−1.09) | 0.93 (0.74−1.16) | 0.93 (0.74−1.17) | 0.65 |
| Model 2 | 1.00 (Ref.) | 0.93 (0.73−1.17) | 0.96 (0.75−1.22) | 1.00 (0.78−1.28) | 0.69 |
| Model 3 | 1.00 (Ref.) | 0.94 (0.74−1.18) | 0.97 (0.76−1.24) | 1.01 (0.78−1.29) | 0.71 |
| The values are n or hazard ratios (95% confidence intervals). Model 1: Adjusted for age, sex, and race/ethnicity. Model 2: Adjusted for covariates in Model 1 plus education, family income, smoking status, alcohol intake, physical activity, HEI-2015, total energy intake, PUFA intake, SFA intake, protein intake, carbohydrate intake, and mutual adjustment for remaining MUFAs where appropriate (palmitoleic acid, oleic acid, gadoleic acid, and erucic acid). Model 3: Adjusted for covariates in Model 2 plus body mass index (calculated as kg/m2). |
|||||
DownLoad:
CSV
| Quartiles of different dietary MUFA intake | P value for trend | ||||
| Q1 | Q2 | Q3 | Q4 | ||
| Total MUFA | |||||
| Median intake (g/d) | 11.13 | 20.12 | 29.72 | 46.65 | |
| Deaths/person-years | 944/ |
709/ |
|||
| Model 1 | 1.00 (Ref.) | 0.86 (0.75−0.98) | 0.85 (0.74−0.98) | 0.74 (0.63−0.87) | <0.001 |
| Model 2 | 1.00 (Ref.) | 0.90 (0.77−1.04) | 0.91 (0.75−1.10) | 0.77 (0.60−1.00) | 0.08 |
| Model 3 | 1.00 (Ref.) | 0.90 (0.77−1.04) | 0.90 (0.74−1.09) | 0.77 (0.60−0.99) | 0.07 |
| Palmitoleic acid | |||||
| Median intake (g/d) | 0.36 | 0.74 | 1.19 | 2.07 | |
| Deaths/person-years | 945/ |
847/ |
|||
| Model 1 | 1.00 (Ref.) | 0.92 (0.82−1.03) | 0.88 (0.77−1.00) | 0.89 (0.76−1.04) | 0.10 |
| Model 2 | 1.00 (Ref.) | 0.94 (0.82−1.09) | 0.92 (0.79−1.07) | 0.93 (0.74−1.16) | 0.52 |
| Model 3 | 1.00 (Ref.) | 0.96 (0.83−1.10) | 0.92 (0.79−1.07) | 0.93 (0.75−1.16) | 0.54 |
| Oleic acid | |||||
| Median intake (g/d) | 10.27 | 18.72 | 27.69 | 43.59 | |
| Deaths/person-years | 943/ |
715/ |
|||
| Model 1 | 1.00 (Ref.) | 0.88 (0.77−1.01) | 0.86 (0.75−0.99) | 0.74 (0.63−0.87) | <0.001 |
| Model 2 | 1.00 (Ref.) | 0.92 (0.79−1.06) | 0.92 (0.76−1.11) | 0.79 (0.63−1.00) | 0.08 |
| Model 3 | 1.00 (Ref.) | 0.91 (0.79−1.06) | 0.91 (0.76−1.10) | 0.78 (0.62−0.99) | 0.06 |
| Gadoleic acid | |||||
| Median intake (g/d) | 0.06 | 0.14 | 0.25 | 0.47 | |
| Deaths/person-years | 755/ |
648/ |
|||
| Model 1 | 1.00 (Ref.) | 0.95 (0.84−1.06) | 0.82 (0.73−0.93) | 0.83 (0.73−0.94) | <0.001 |
| Model 2 | 1.00 (Ref.) | 1.05 (0.92−1.20) | 0.95 (0.83−1.09) | 1.03 (0.87−1.24) | 0.64 |
| Model 3 | 1.00 (Ref.) | 1.05 (0.92−1.19) | 0.96 (0.84−1.09) | 1.05 (0.89−1.25) | 0.60 |
| Erucic acid | |||||
| Median intake (g/d) | 0.00 | 0.003 | 0.01 | 0.06 | |
| Deaths/person-years | 870/ |
913/ |
913/ |
||
| Model 1 | 1.00 (Ref.) | 0.92 (0.82−1.04) | 0.84 (0.75−0.94) | 0.84 (0.74−0.95) | 0.20 |
| Model 2 | 1.00 (Ref.) | 1.02 (0.90−1.15) | 0.90 (0.80−1.02) | 0.96 (0.84−1.09) | 0.34 |
| Model 3 | 1.00 (Ref.) | 1.02 (0.90−1.15) | 0.91 (0.80−1.02) | 0.95 (0.84−1.09) | 0.32 |
| The values are n or hazard ratios (95% confidence intervals). Model 1: Adjusted for age, sex, and race/ethnicity. Model 2: Adjusted for covariates in Model 1 plus education, family income, smoking status, alcohol intake, physical activity, HEI-2015, total energy intake, PUFA intake, SFA intake, protein intake, carbohydrate intake, and mutual adjustment for remaining MUFAs where appropriate (palmitoleic acid, oleic acid, gadoleic acid, and erucic acid). Model 3: Adjusted for covariates in Model 2 plus body mass index (calculated as kg/m2). |
|||||
DownLoad:
CSV
| Vegetable oil consumption | ||
| No | Yes | |
| Olive oil | ||
| CVD mortality | ||
| Deaths/person-years | 143/ |
77/ |
| Model 1 | 1.00 (Ref.) | 0.48 (0.31−0.76) |
| Model 2 | 1.00 (Ref.) | 0.61 (0.37−0.99) |
| Model 3 | 1.00 (Ref.) | 0.61 (0.37−1.01) |
| All-cause mortality | ||
| Deaths/person-years | 394/ |
269/ |
| Model 1 | 1.00 (Ref.) | 0.73 (0.58−0.91) |
| Model 2 | 1.00 (Ref.) | 0.89 (0.70−1.13) |
| Model 3 | 1.00 (Ref.) | 0.90 (0.70−1.16) |
| Corn oil | ||
| CVD mortality | ||
| Deaths/person-years | 142/ |
78/ |
| Model 1 | 1.00 (Ref.) | 1.44 (0.92−2.25) |
| Model 2 | 1.00 (Ref.) | 1.22 (0.75−1.98) |
| Model 3 | 1.00 (Ref.) | 1.17 (0.78−1.93) |
| All-cause mortality | ||
| Deaths/person-years | 437/ |
226/ |
| Model 1 | 1.00 (Ref.) | 1.19 (0.96−1.48) |
| Model 2 | 1.00 (Ref.) | 1.08 (0.86−1.35) |
| Model 3 | 1.00 (Ref.) | 1.05 (0.84−1.33) |
| Canola/rapeseed oil | ||
| CVD mortality | ||
| Deaths/person-years | 155/ |
65/ |
| Model 1 | 1.00 (Ref.) | 0.86 (0.54−1.39) |
| Model 2 | 1.00 (Ref.) | 1.02 (0.65−1.59) |
| Model 3 | 1.00 (Ref.) | 1.01 (0.65−1.58) |
| All-cause mortality | ||
| Deaths/person-years | 450/ |
213/ |
| Model 1 | 1.00 (Ref.) | 0.82 (0.60−1.13) |
| Model 2 | 1.00 (Ref.) | 0.93 (0.68−1.29) |
| Model 3 | 1.00 (Ref.) | 0.94 (0.69−1.28) |
| The values are n or hazard ratios (95% confidence intervals). Model 1: Adjusted for age, sex, and race/ethnicity. Model 2: Adjusted for covariates in Model 1 plus education, family income, smoking status, alcohol intake, physical activity, HEI-2015, total energy intake, consumption of nonvegetable dietary fats (margarine, butter, and mayonnaise), and mutual adjustment for consumption of remaining oils (olive oil, corn oil, and canola oil). Model 3: Adjusted for covariates in Model 2 plus body mass index (calculated as kg/m2). |
||
DownLoad:
CSV
| Vegetable oil consumption | ||||
| No vegetable oil | Olive oil exclusively | Olive oil and other vegetable oil | Other vegetable oil | |
| CVD mortality | ||||
| Deaths/person-years | 46/ |
25/ |
48/ |
101/ |
| Model 1 | 1.00 (Ref.) | 0.30 (0.17−0.51) | 0.46 (0.23−0.91) | 0.73 (0.49−1.09) |
| Model 2 | 1.00 (Ref.) | 0.36 (0.19−0.69) | 0.59 (0.27−1.31) | 0.71 (0.46−1.11) |
| Model 3 | 1.00 (Ref.) | 0.36 (0.19−0.69) | 0.59 (0.27−1.32) | 0.73 (0.46−1.14) |
| All-cause mortality | ||||
| Deaths/person-years | 107/ |
101/ |
153/ |
302/ |
| Model 1 | 1.00 (Ref.) | 0.66 (0.49−0.89) | 0.68 (0.47−0.97) | 0.89 (0.65−1.21) |
| Model 2 | 1.00 (Ref.) | 0.79 (0.55−1.14) | 0.83 (0.57−1.21) | 0.88 (0.65−1.20) |
| Model 3 | 1.00 (Ref.) | 0.80 (0.55−1.17) | 0.84 (0.58−1.23) | 0.89 (0.65−1.22) |
| The values are n or hazard ratios (95% confidence intervals). Model 1: Adjusted for age, sex, and race/ethnicity. Model 2: Adjusted for covariates in Model 1 plus education, family income, smoking status, alcohol intake, physical activity, HEI-2015 score, total energy intake, and consumption of nonvegetable dietary fats (margarine, butter, and mayonnaise). Model 3: Adjusted for covariates in Model 2 plus body mass index (calculated as kg/m2). |
||||
DownLoad:
CSV