
PDF format
JUSTC-2023-0067 Supporting information
Download(1020KB)JUSTC-2023-0067 Supporting information
Figures of the Article
-
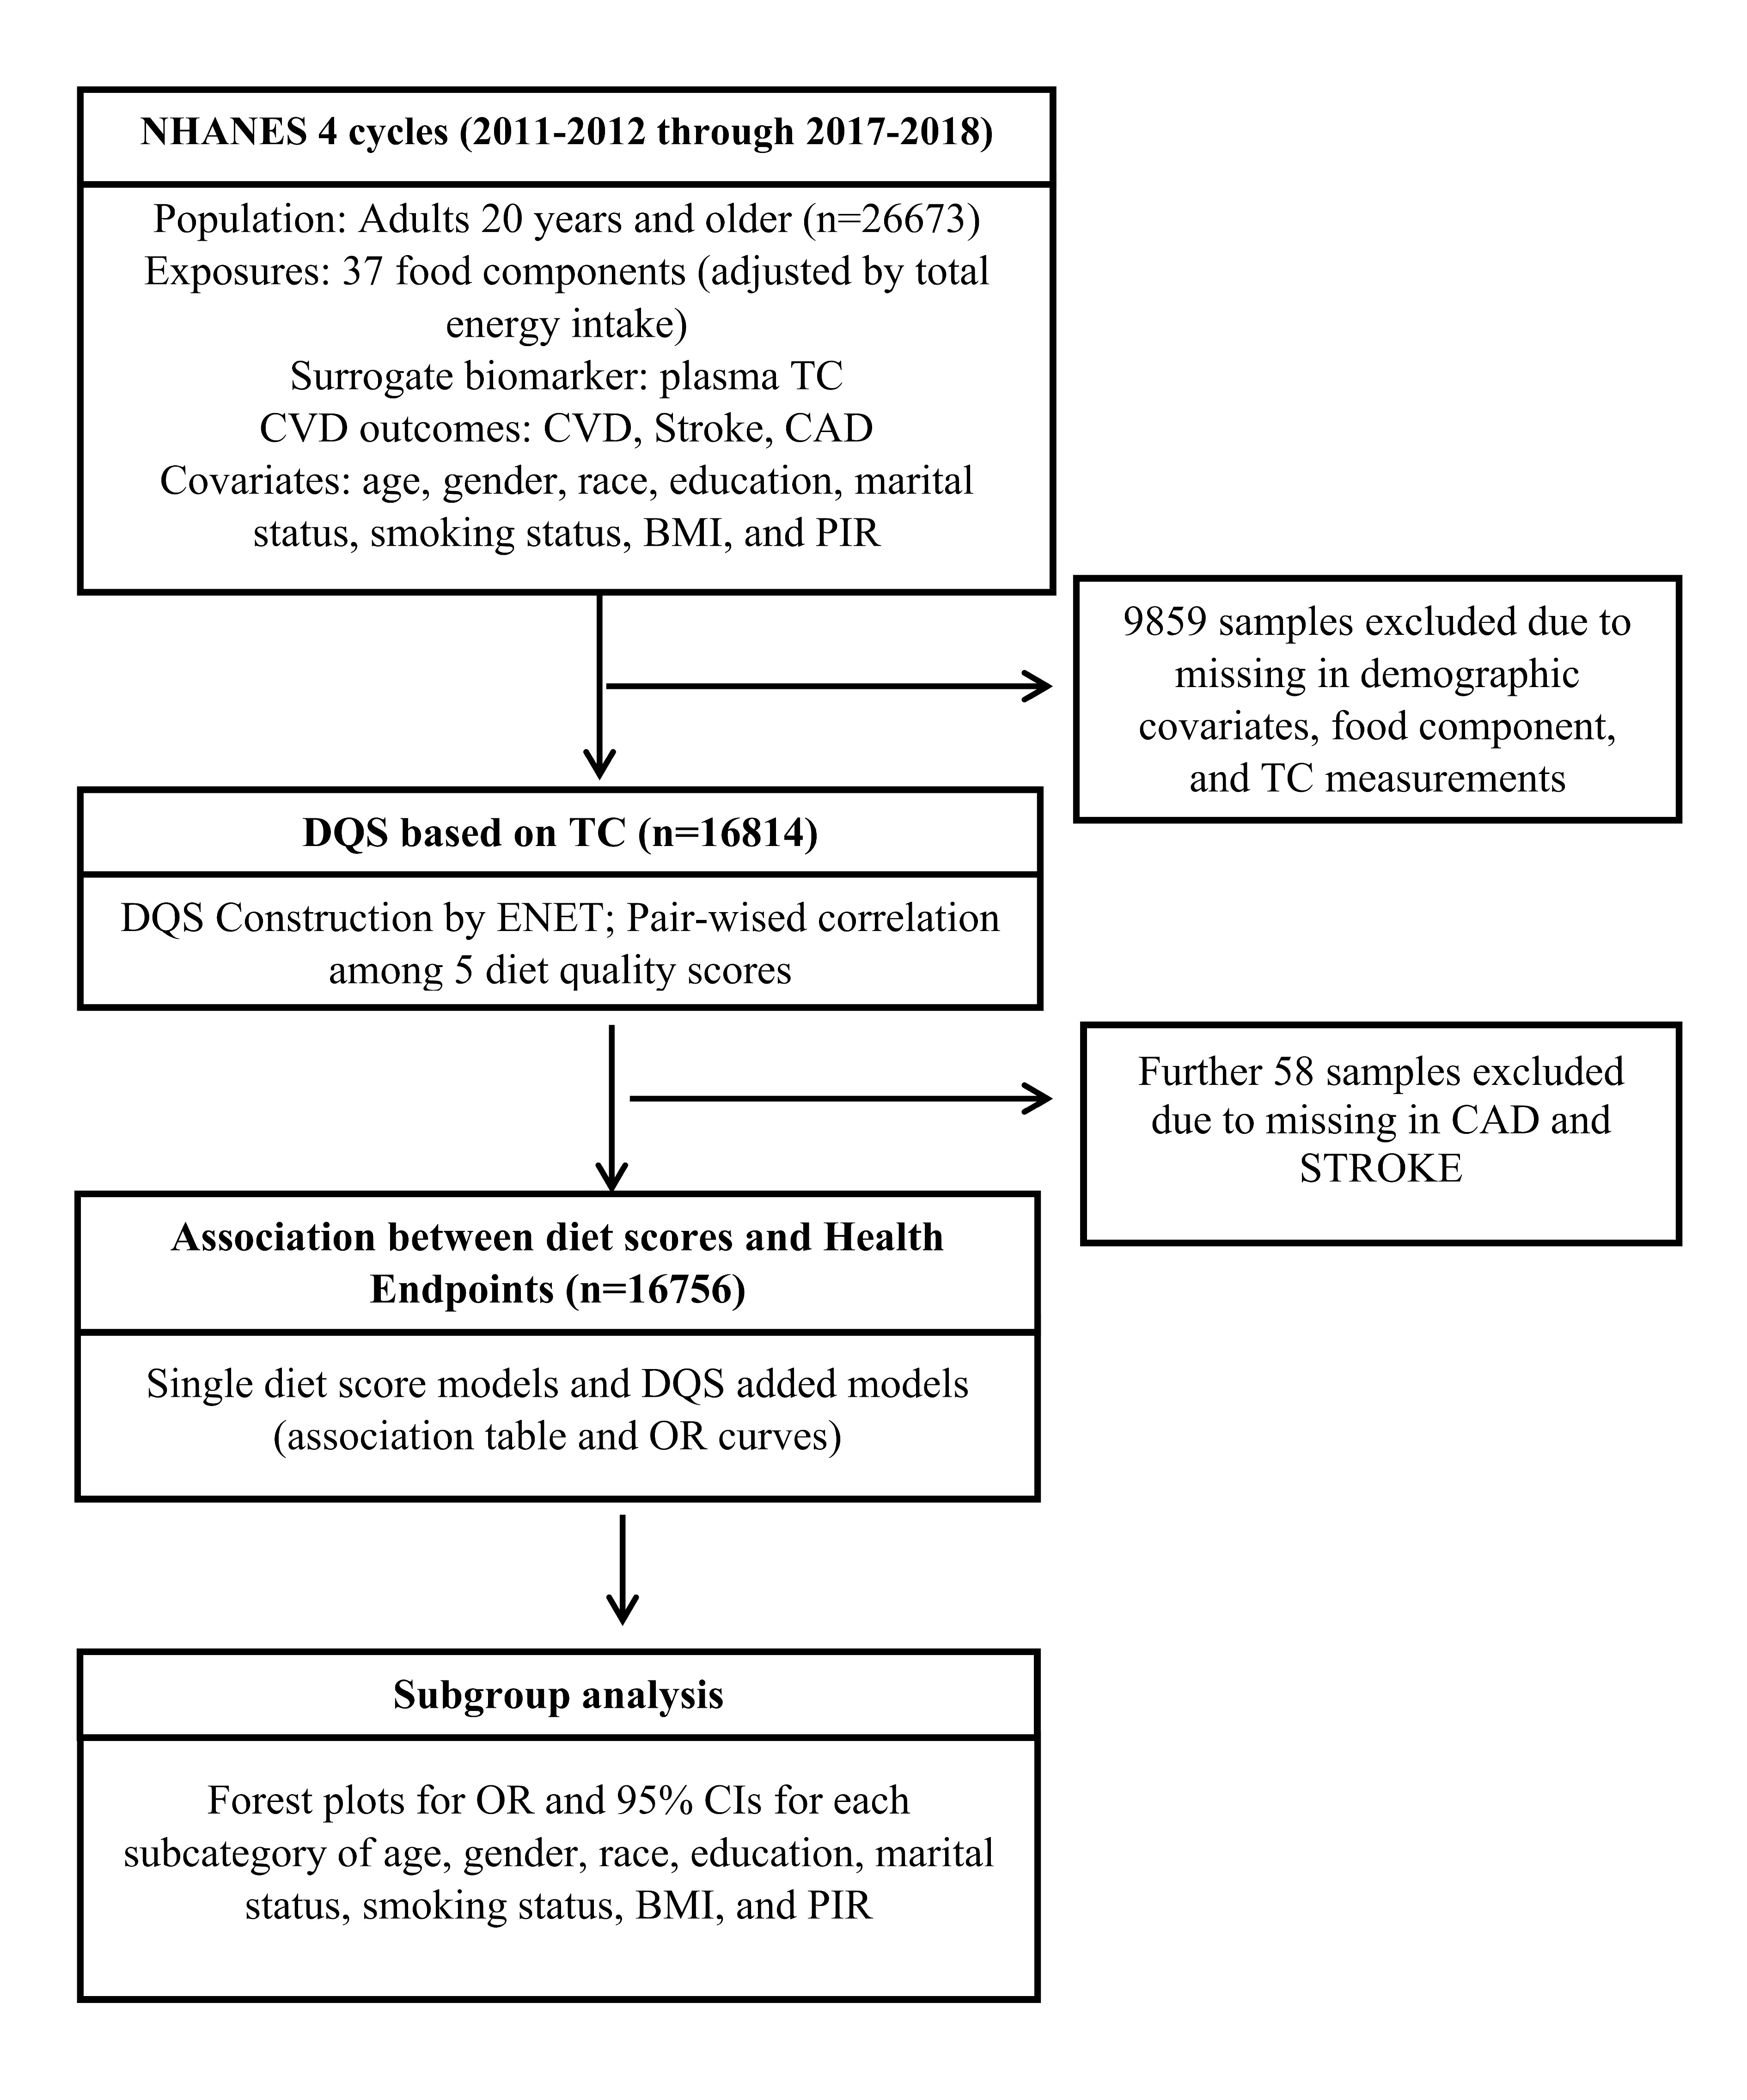
![]() Schematic diagram of data preprocessing, construction of DQS and analytic methods. CVD: cardiovascular disease; CAD: coronary artery disease; CHF: congestive heart failure; MI: heart attack or myocardial infarction; STROKE: stroke; ENET: elastic net regression.
Schematic diagram of data preprocessing, construction of DQS and analytic methods. CVD: cardiovascular disease; CAD: coronary artery disease; CHF: congestive heart failure; MI: heart attack or myocardial infarction; STROKE: stroke; ENET: elastic net regression.
-
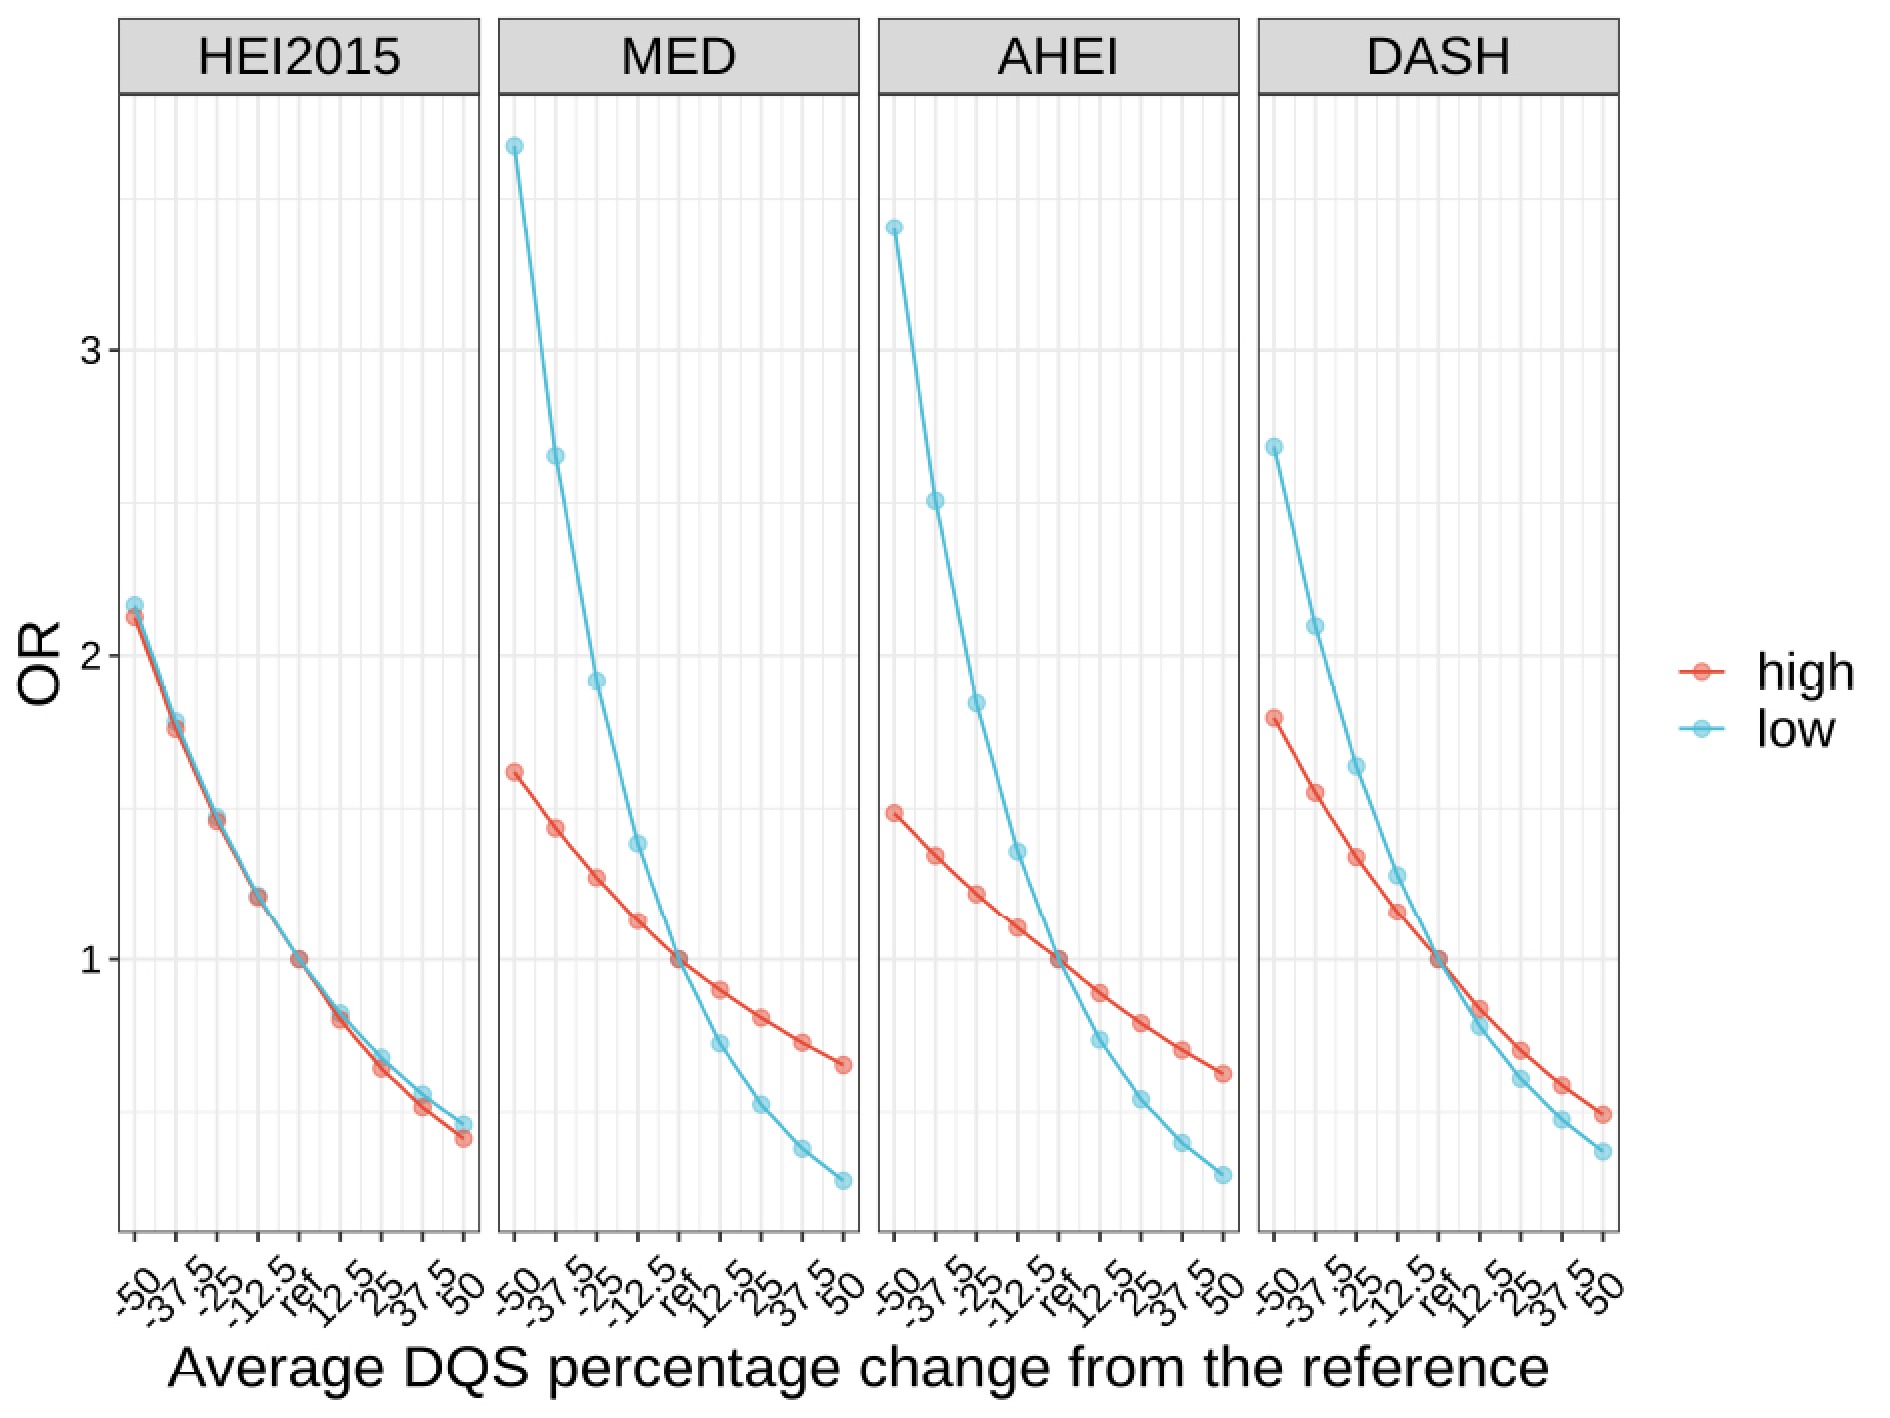
![]() Odds ratio trends for the population with a 50%, 37.5%, 25%, and 12.5% reduction and a 12.5%, 25%, 37.5% and 50% increase in median diet score DQS relative to the reference population in stratified high and low common diet score groups. Reference diet scores were defined as the median value of DQS without incident CVDs.
Odds ratio trends for the population with a 50%, 37.5%, 25%, and 12.5% reduction and a 12.5%, 25%, 37.5% and 50% increase in median diet score DQS relative to the reference population in stratified high and low common diet score groups. Reference diet scores were defined as the median value of DQS without incident CVDs.
-
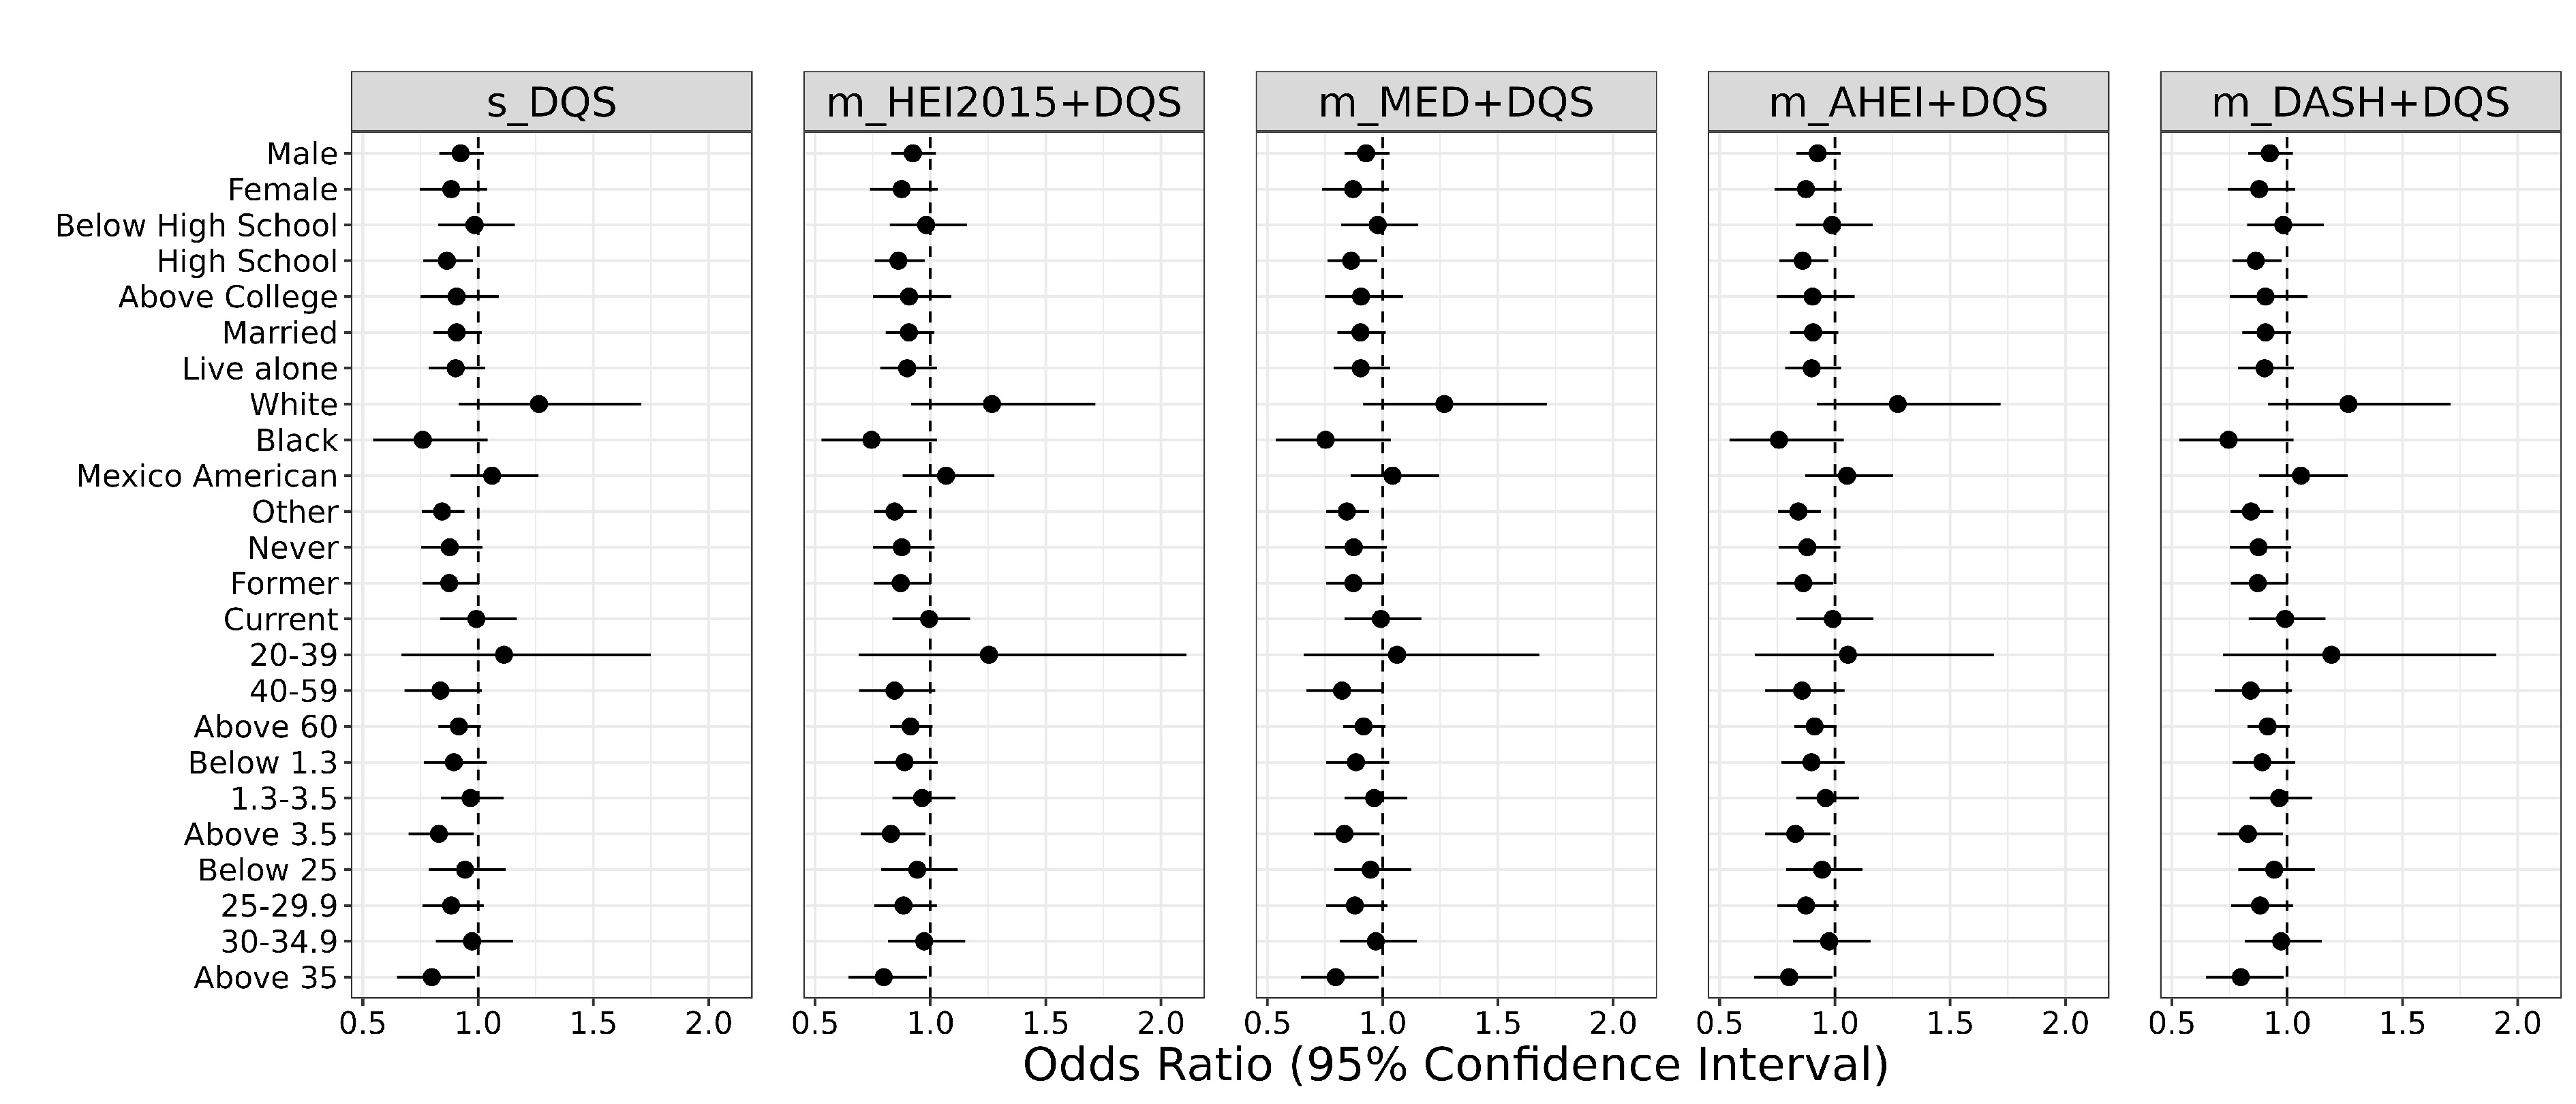
![]() Stratified analysis for potential risk modifiers including gender, education, marital status, race, smoking status, PIR and BMI. OR and 95% confidence intervals for the univariate diet score model and multiple diet score model for CAD were reported. The columns with “s_” and “m_” refer to the univariate and multiple score regression models, respectively. The “m_HEI2015+DQS” columns refer to the results for DQS in the combined HEI2015 model. Similar explanations for the other columns.
Stratified analysis for potential risk modifiers including gender, education, marital status, race, smoking status, PIR and BMI. OR and 95% confidence intervals for the univariate diet score model and multiple diet score model for CAD were reported. The columns with “s_” and “m_” refer to the univariate and multiple score regression models, respectively. The “m_HEI2015+DQS” columns refer to the results for DQS in the combined HEI2015 model. Similar explanations for the other columns.
Related articles
-
2022, 52(4): 3-1-3-11. DOI: 10.52396/JUSTC-2022-0028
-
2021, 51(4): 308-318. DOI: 10.52396/JUST-2020-0018
-
2020, 50(6): 715-725. DOI: 10.3969/j.issn.0253-2778.2020.06.001
-
2020, 50(5): 570-575. DOI: 10.3969/j.issn.0253-2778.2020.05.003
-
2019, 49(5): 412-421. DOI: 10.3969/j.issn.0253-2778.2019.05.008
-
2016, 46(11): 939-945. DOI: 10.3969/j.issn.0253-2778.2016.11.009
-
2016, 46(2): 138-147. DOI: 10.3969/j.issn.0253-2778.2016.02.007
-
2015, 45(8): 702-708. DOI: 10.3969/j.issn.0253-2778.2015.08.012
-
2014, 44(3): 217-220. DOI: 10.3969/j.issn.0253-2778.2014.03.009
-
2013, 43(11): 941-947. DOI: 10.3969/j.issn.0253-2778.2013.11.010
