
 Download:
Figures of the Article
-
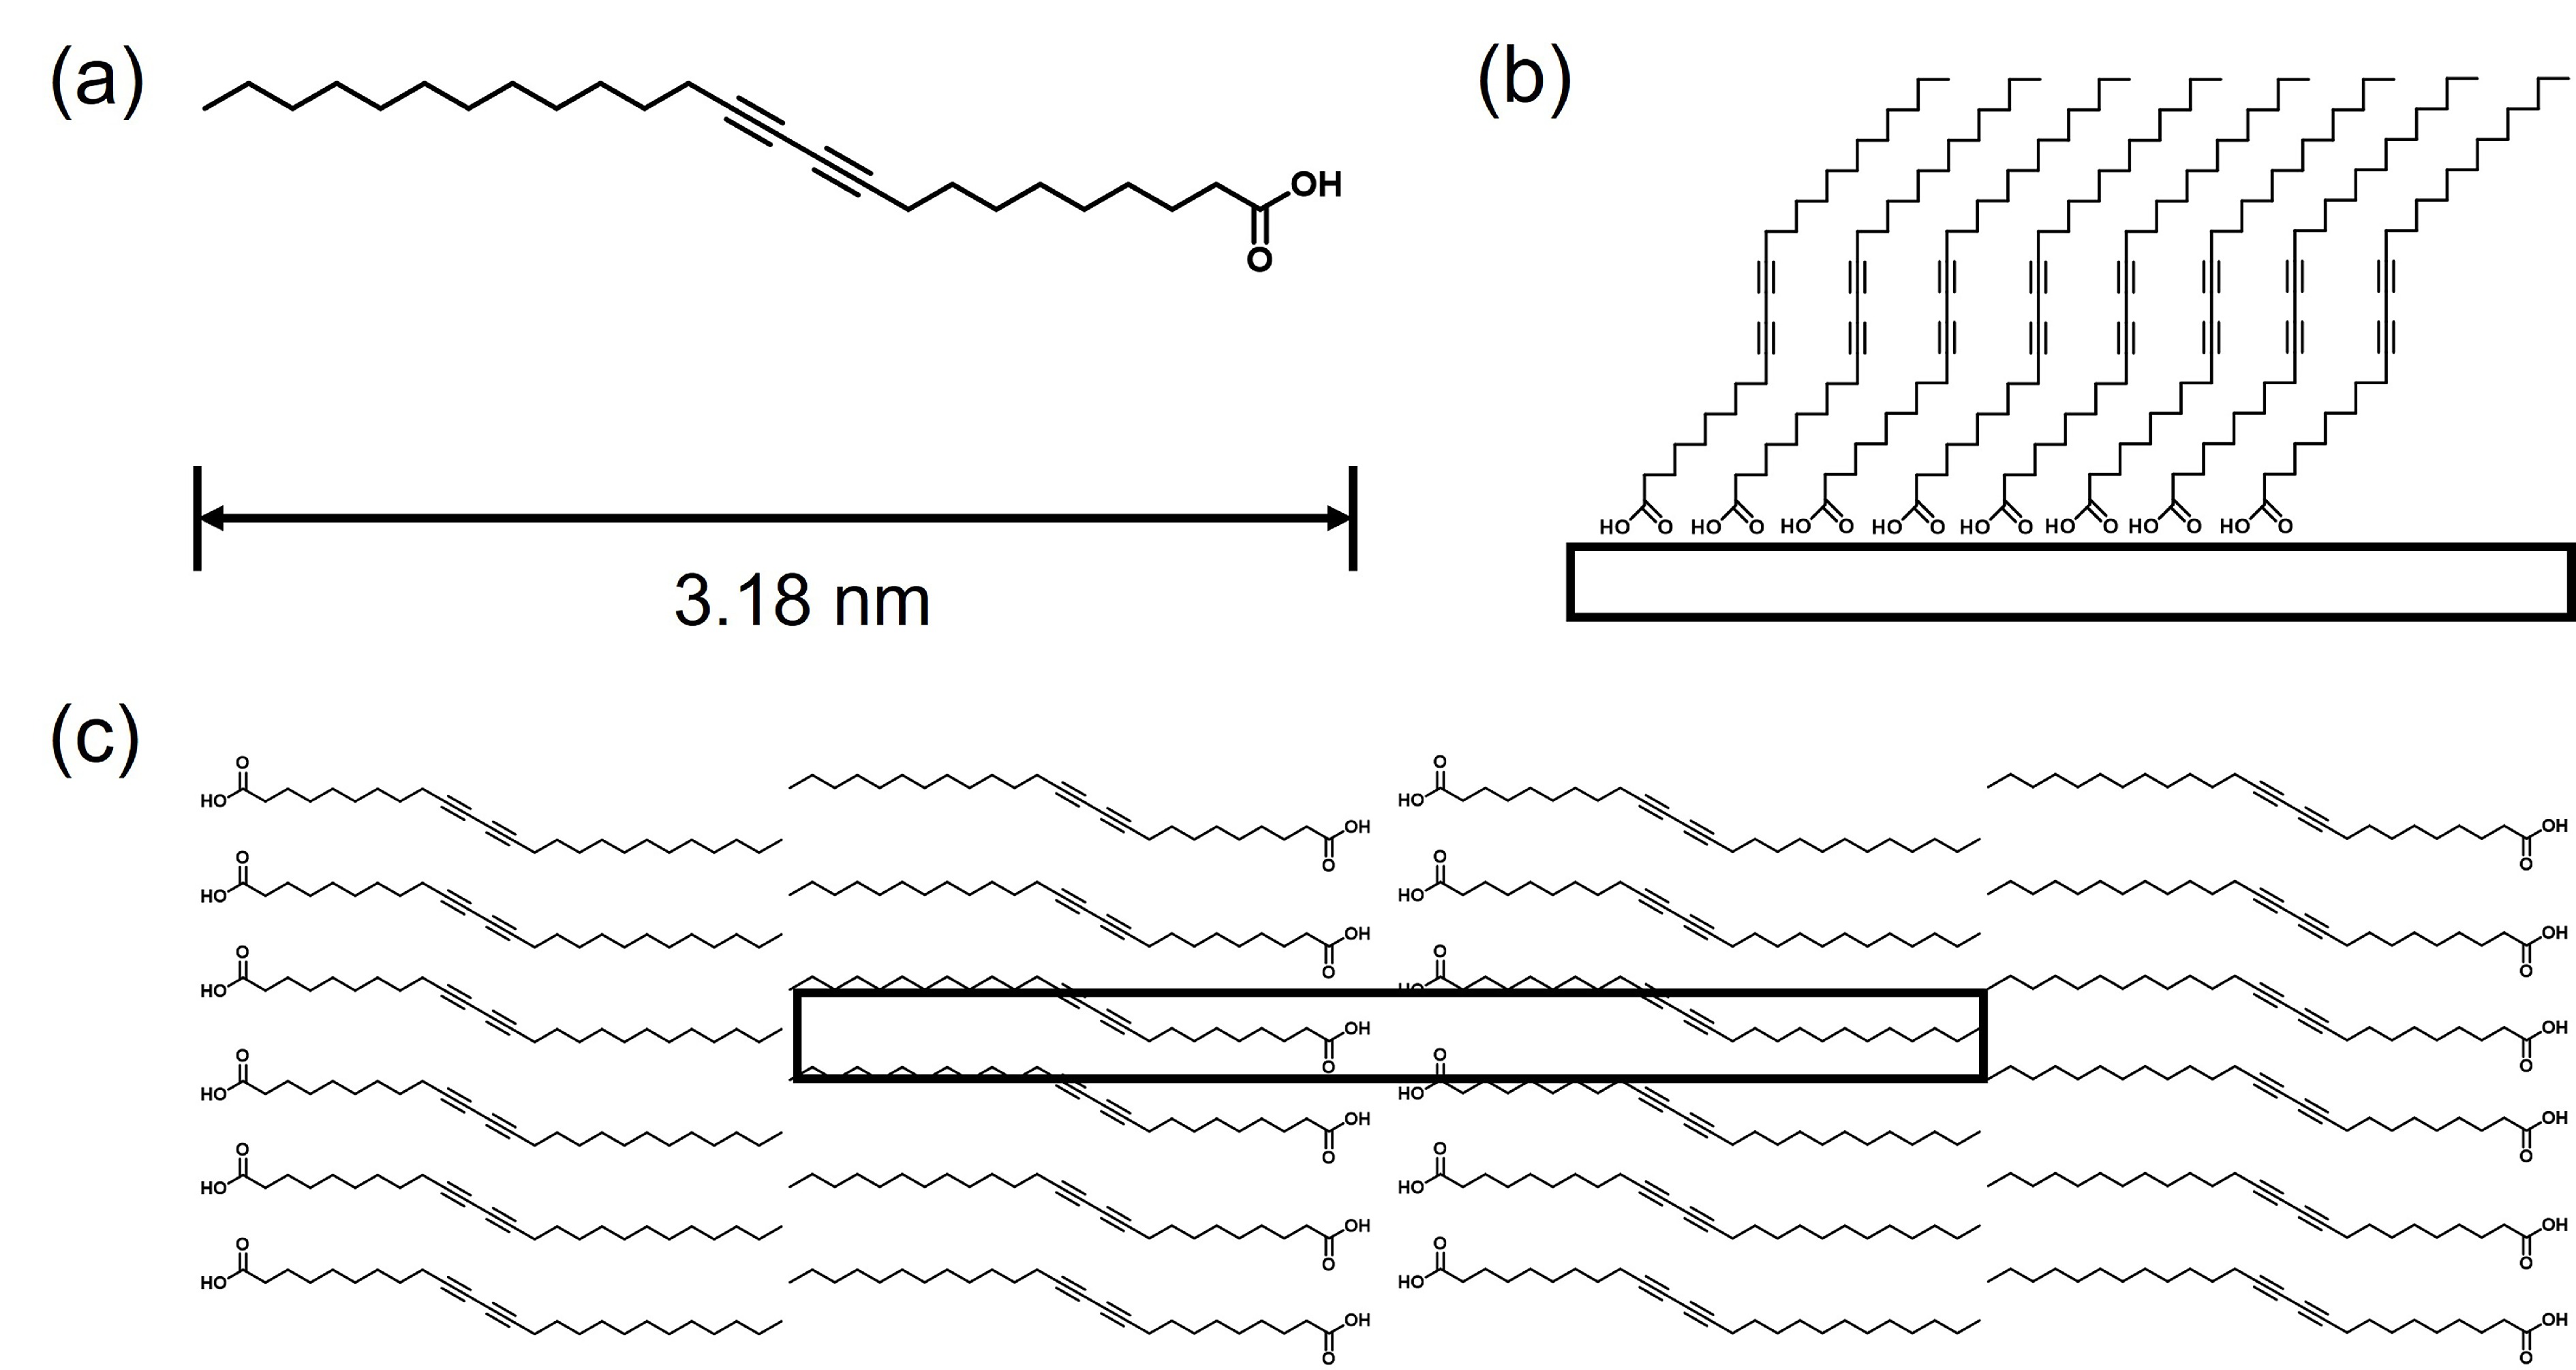
![]() (a) Molecular structure of 10,12-pentacosadiynoic acid. (b, c) The standing-up and flat-lying assembly structures of PCDA on oxide and other inert substrates, respectively. The rectangle in (c) marks the unit cell.
(a) Molecular structure of 10,12-pentacosadiynoic acid. (b, c) The standing-up and flat-lying assembly structures of PCDA on oxide and other inert substrates, respectively. The rectangle in (c) marks the unit cell.
-
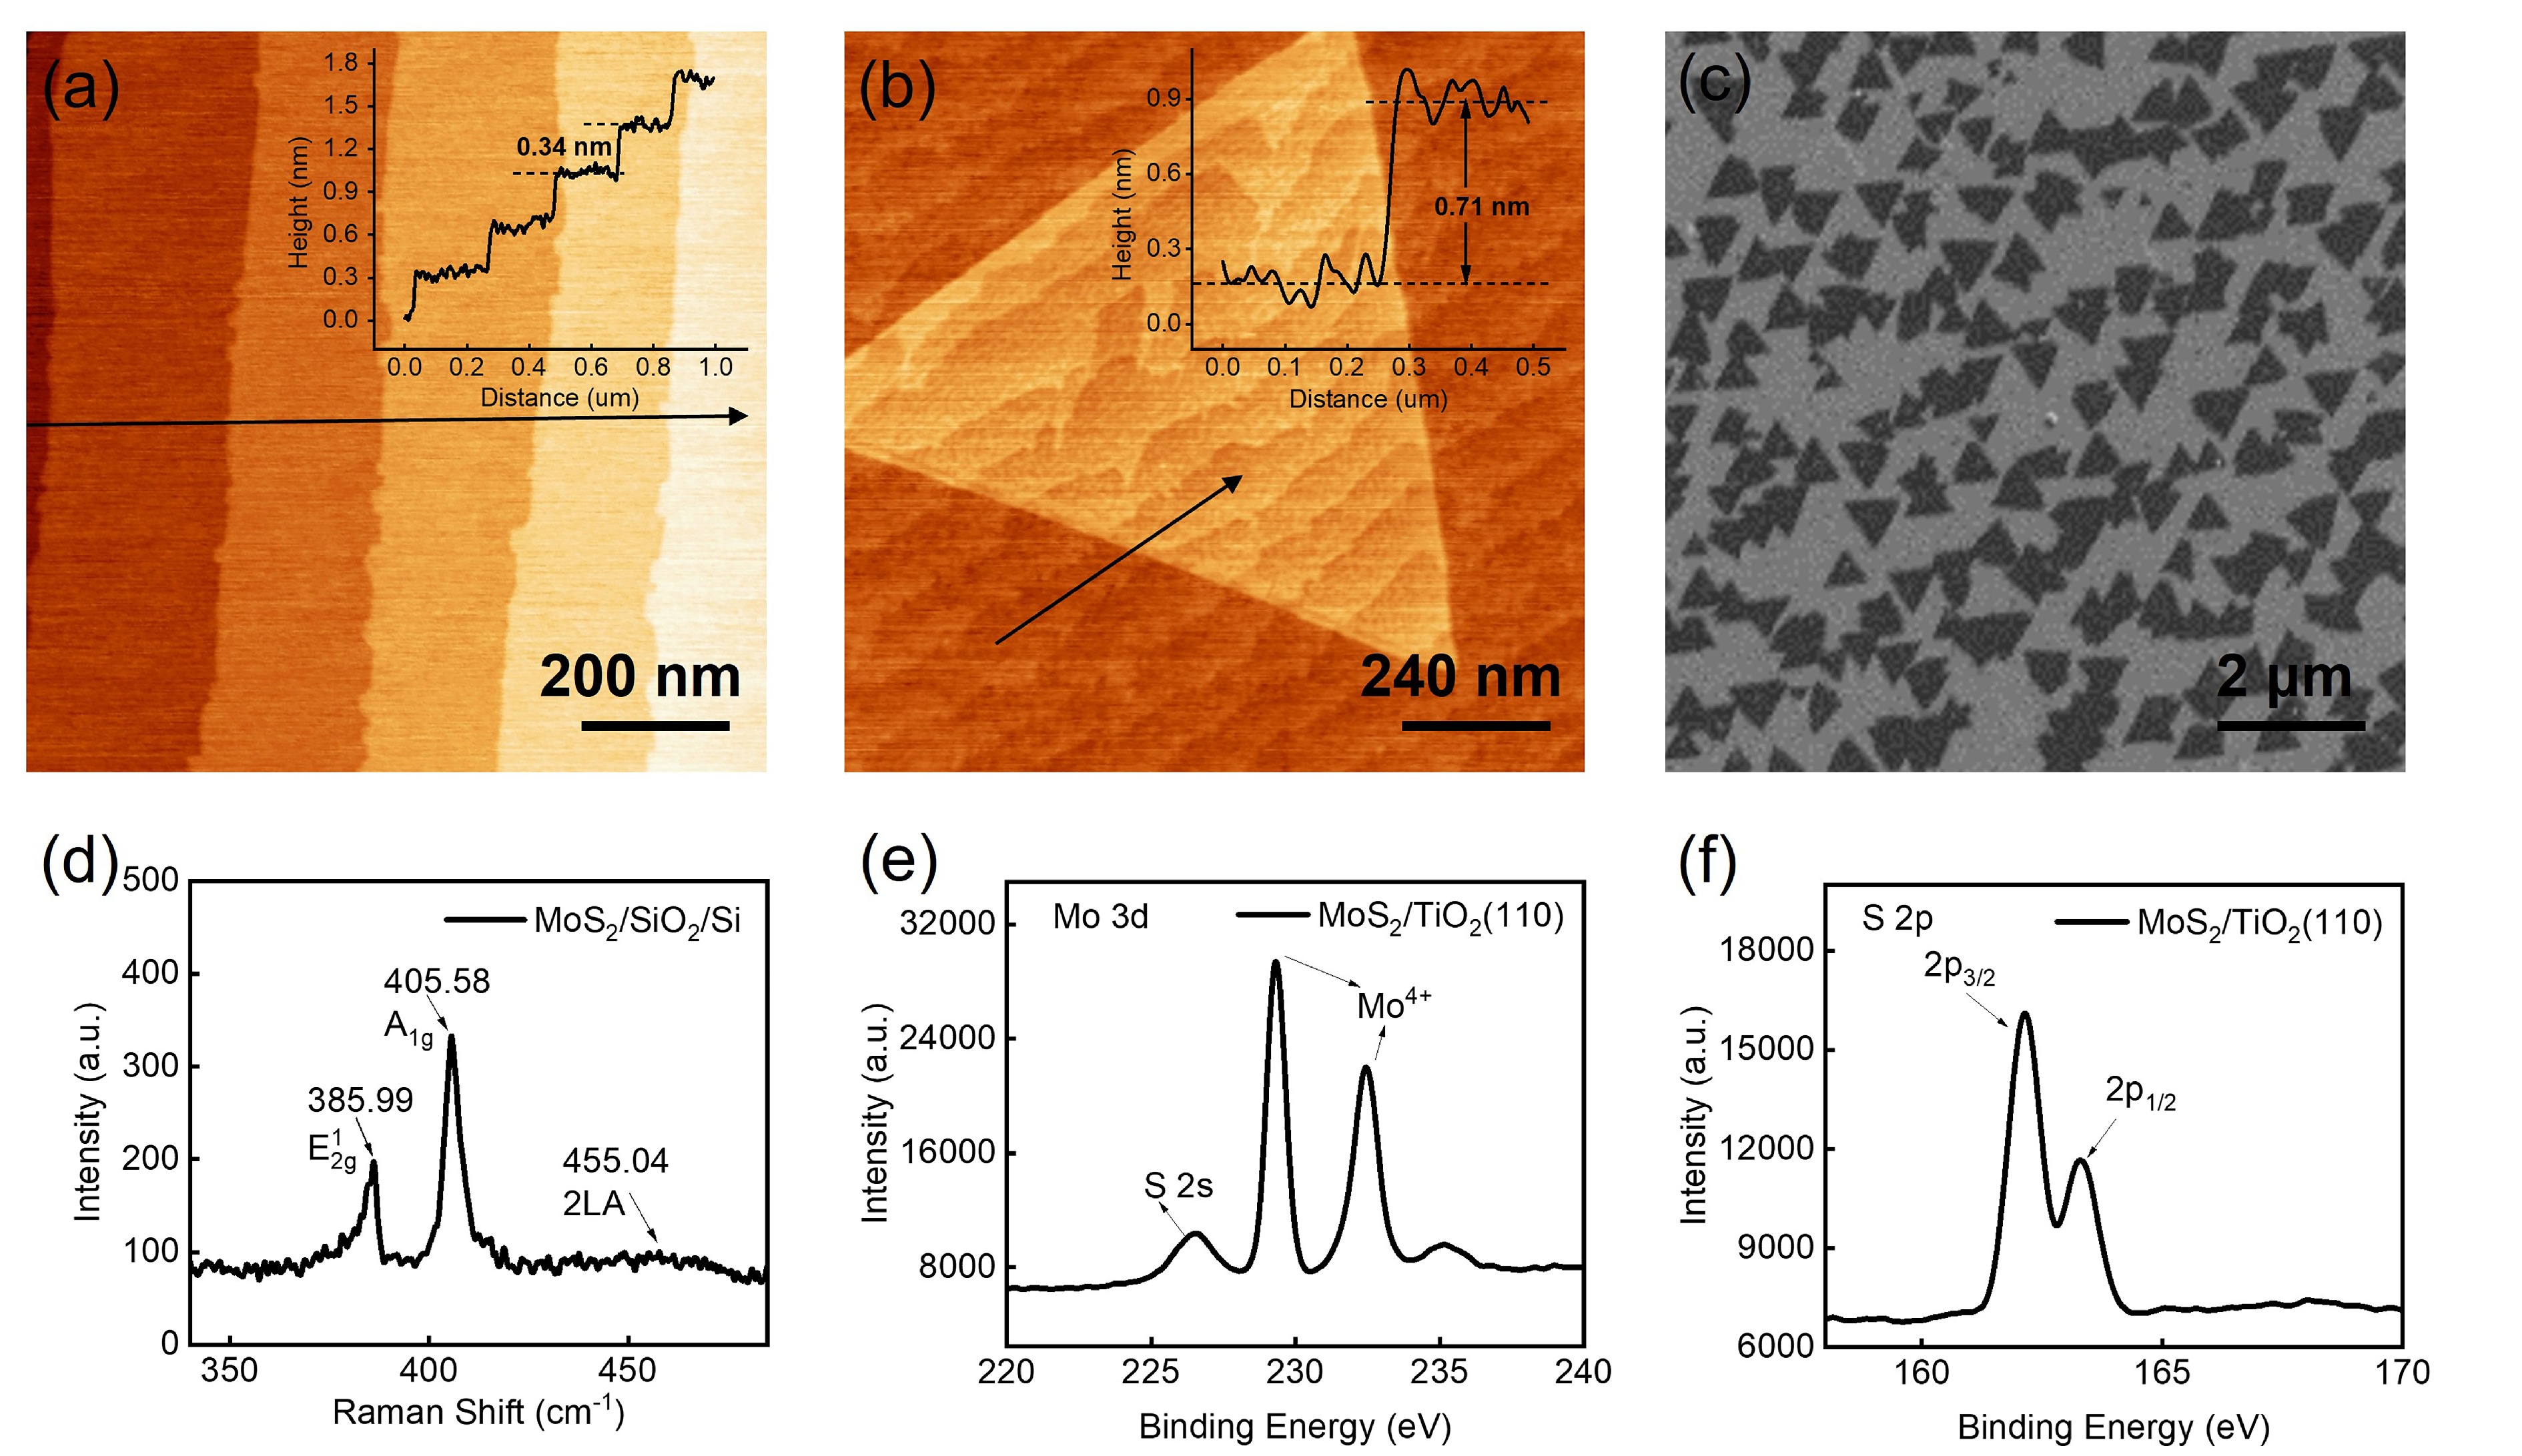
![]() Characterization of the as-prepared MoS2/TiO2 substrate. (a) AFM image of an atomically flat TiO2(110) surface. The inset in the upper right corner shows the profile taken along the black arrow. (b) AFM image of a triangular MoS2 flake on the MoS2/TiO2 surface. The upper right inset shows the height profile measured across the MoS2 boundary along the black arrow. (c) Typical SEM image of the as-prepared MoS2/TiO2 surface. (d) Raman spectrum of MoS2 transferred from TiO2 onto a SiO2/Si substrate. (e, f) High-resolution XPS spectra of Mo 3d and S 2p on MoS2/TiO2.
Characterization of the as-prepared MoS2/TiO2 substrate. (a) AFM image of an atomically flat TiO2(110) surface. The inset in the upper right corner shows the profile taken along the black arrow. (b) AFM image of a triangular MoS2 flake on the MoS2/TiO2 surface. The upper right inset shows the height profile measured across the MoS2 boundary along the black arrow. (c) Typical SEM image of the as-prepared MoS2/TiO2 surface. (d) Raman spectrum of MoS2 transferred from TiO2 onto a SiO2/Si substrate. (e, f) High-resolution XPS spectra of Mo 3d and S 2p on MoS2/TiO2.
-
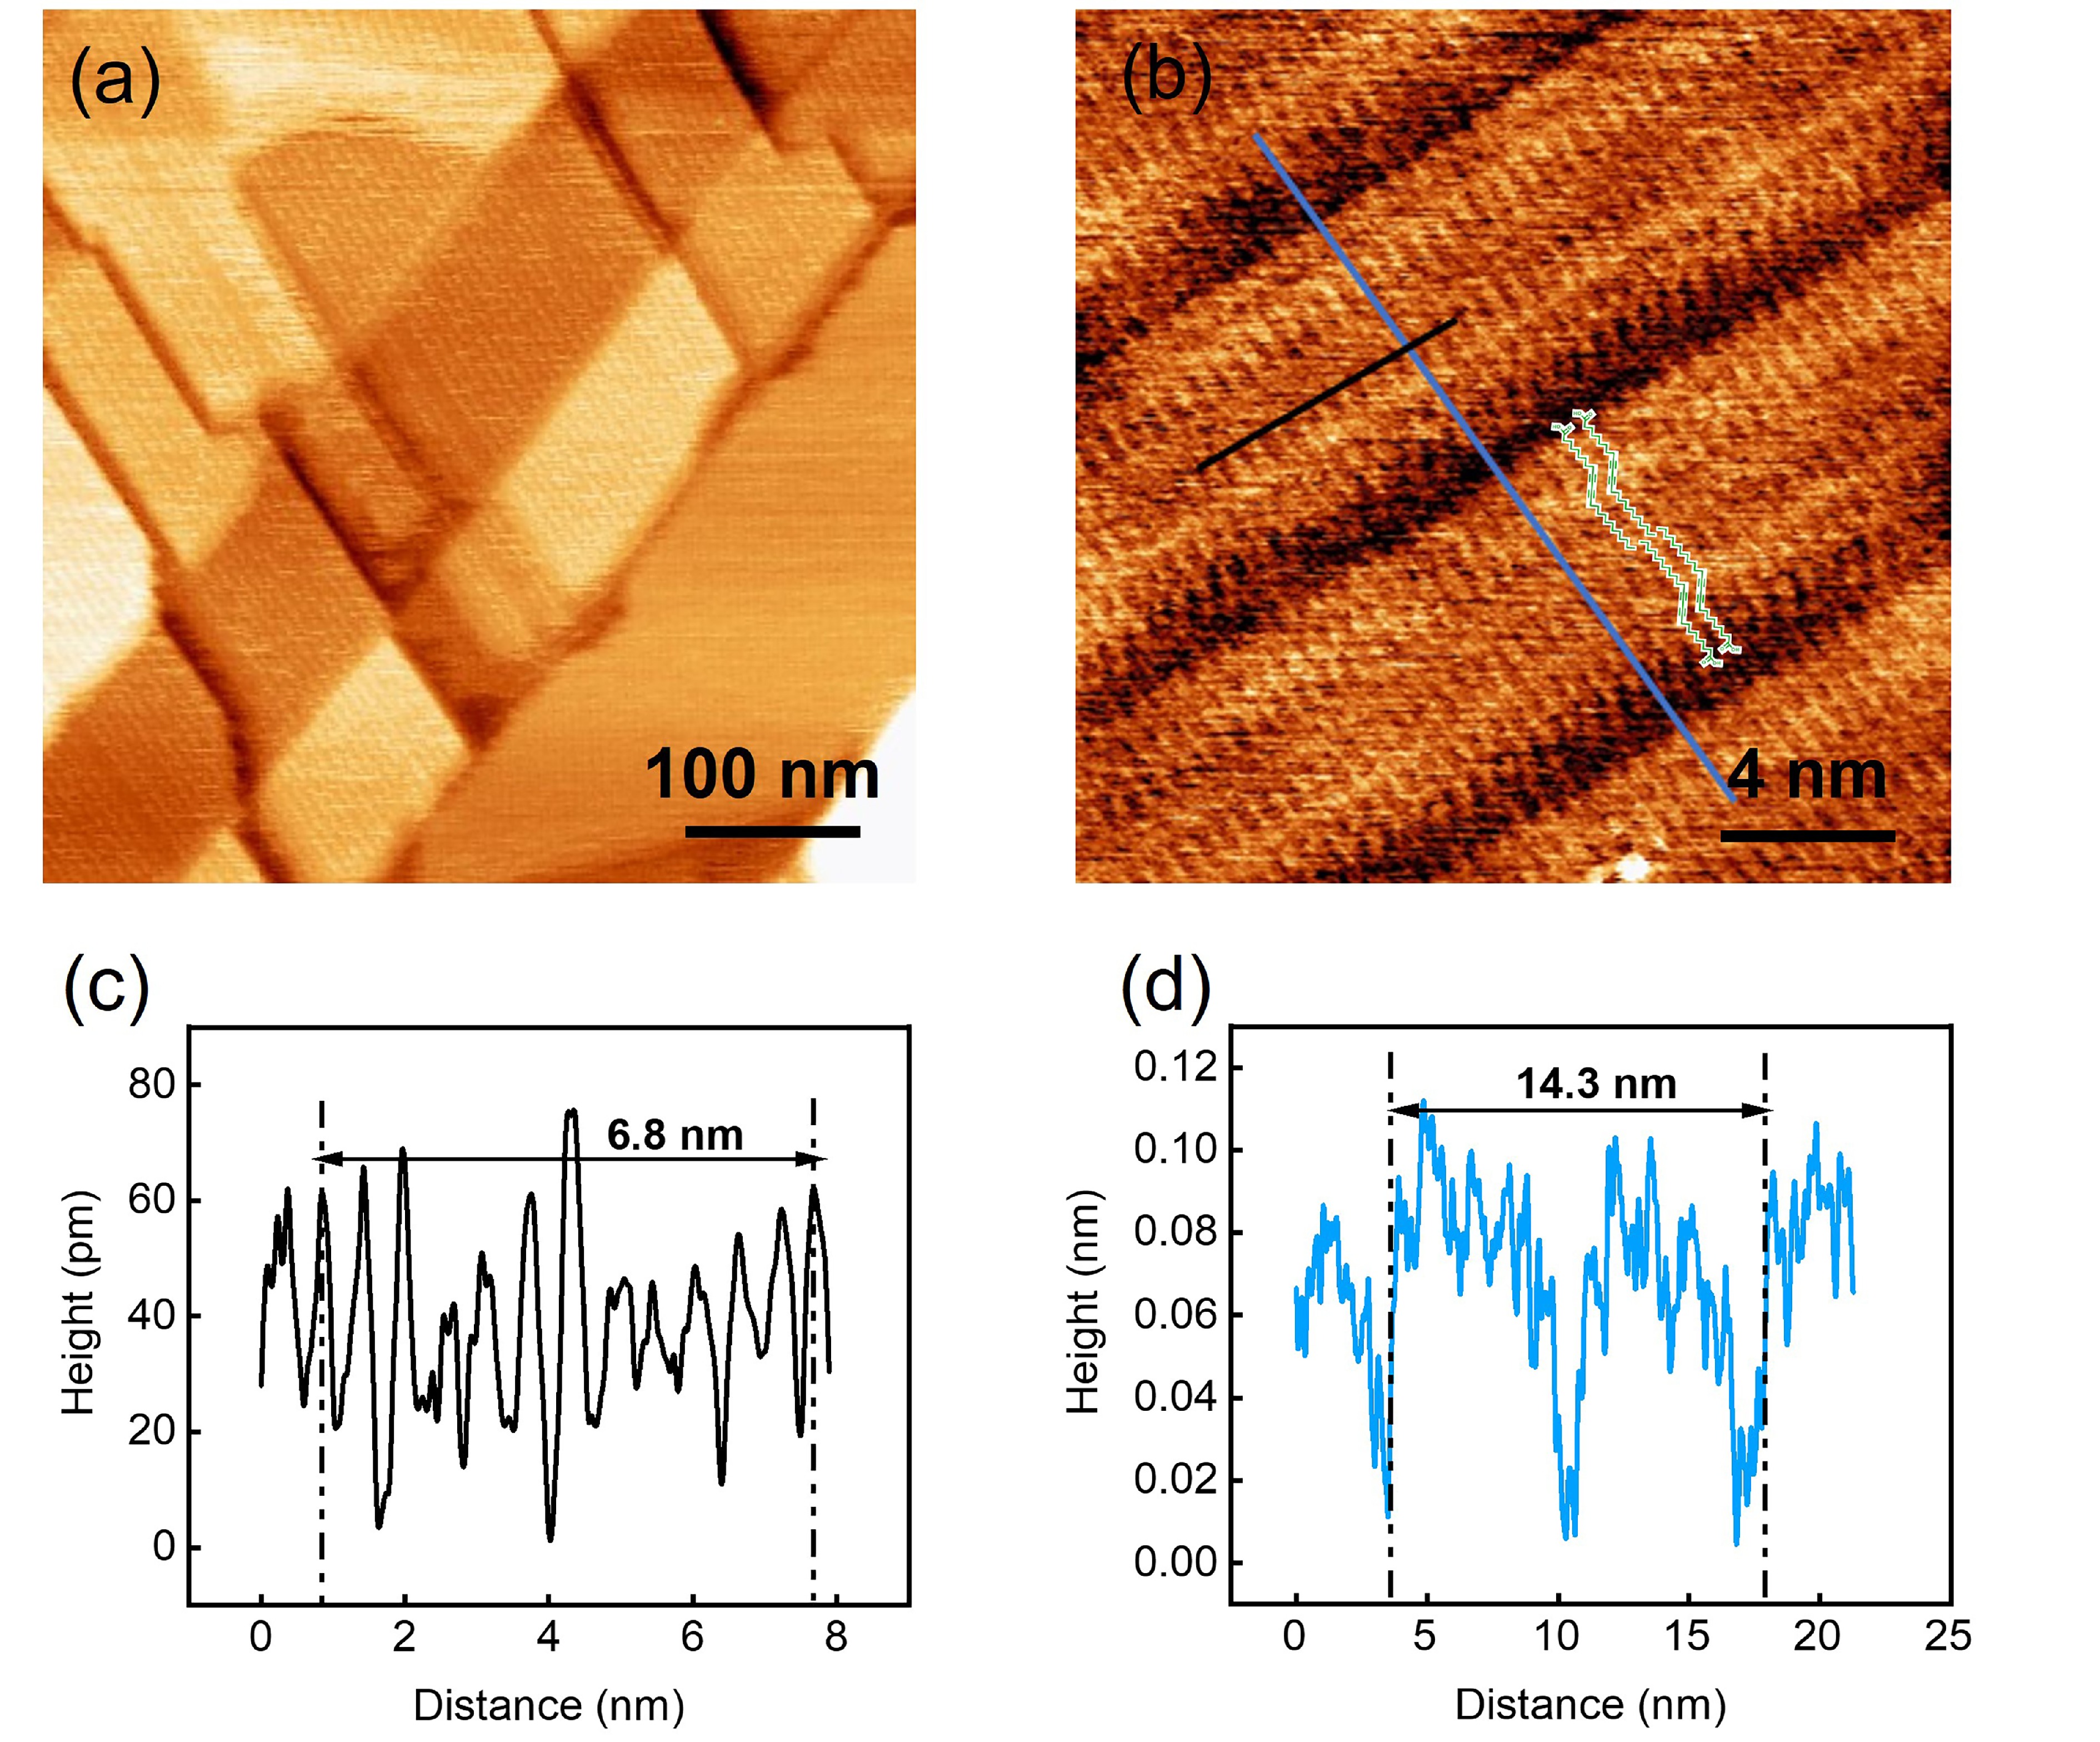
![]() (a) AFM and (b) the corresponding STM characterizations of the self-assembly film of PCDA formed on MoS2. Four PCDA molecular models are overlapped over the STM image. Note that although the film coverage slightly surpasses that of the monolayer, STM can only observe the structure of the bottom layer. (c, d) are the section profiles taken along the black and blue lines, respectively. The measured distances correspond to ten and double times the periodicities in these directions.
(a) AFM and (b) the corresponding STM characterizations of the self-assembly film of PCDA formed on MoS2. Four PCDA molecular models are overlapped over the STM image. Note that although the film coverage slightly surpasses that of the monolayer, STM can only observe the structure of the bottom layer. (c, d) are the section profiles taken along the black and blue lines, respectively. The measured distances correspond to ten and double times the periodicities in these directions.
-
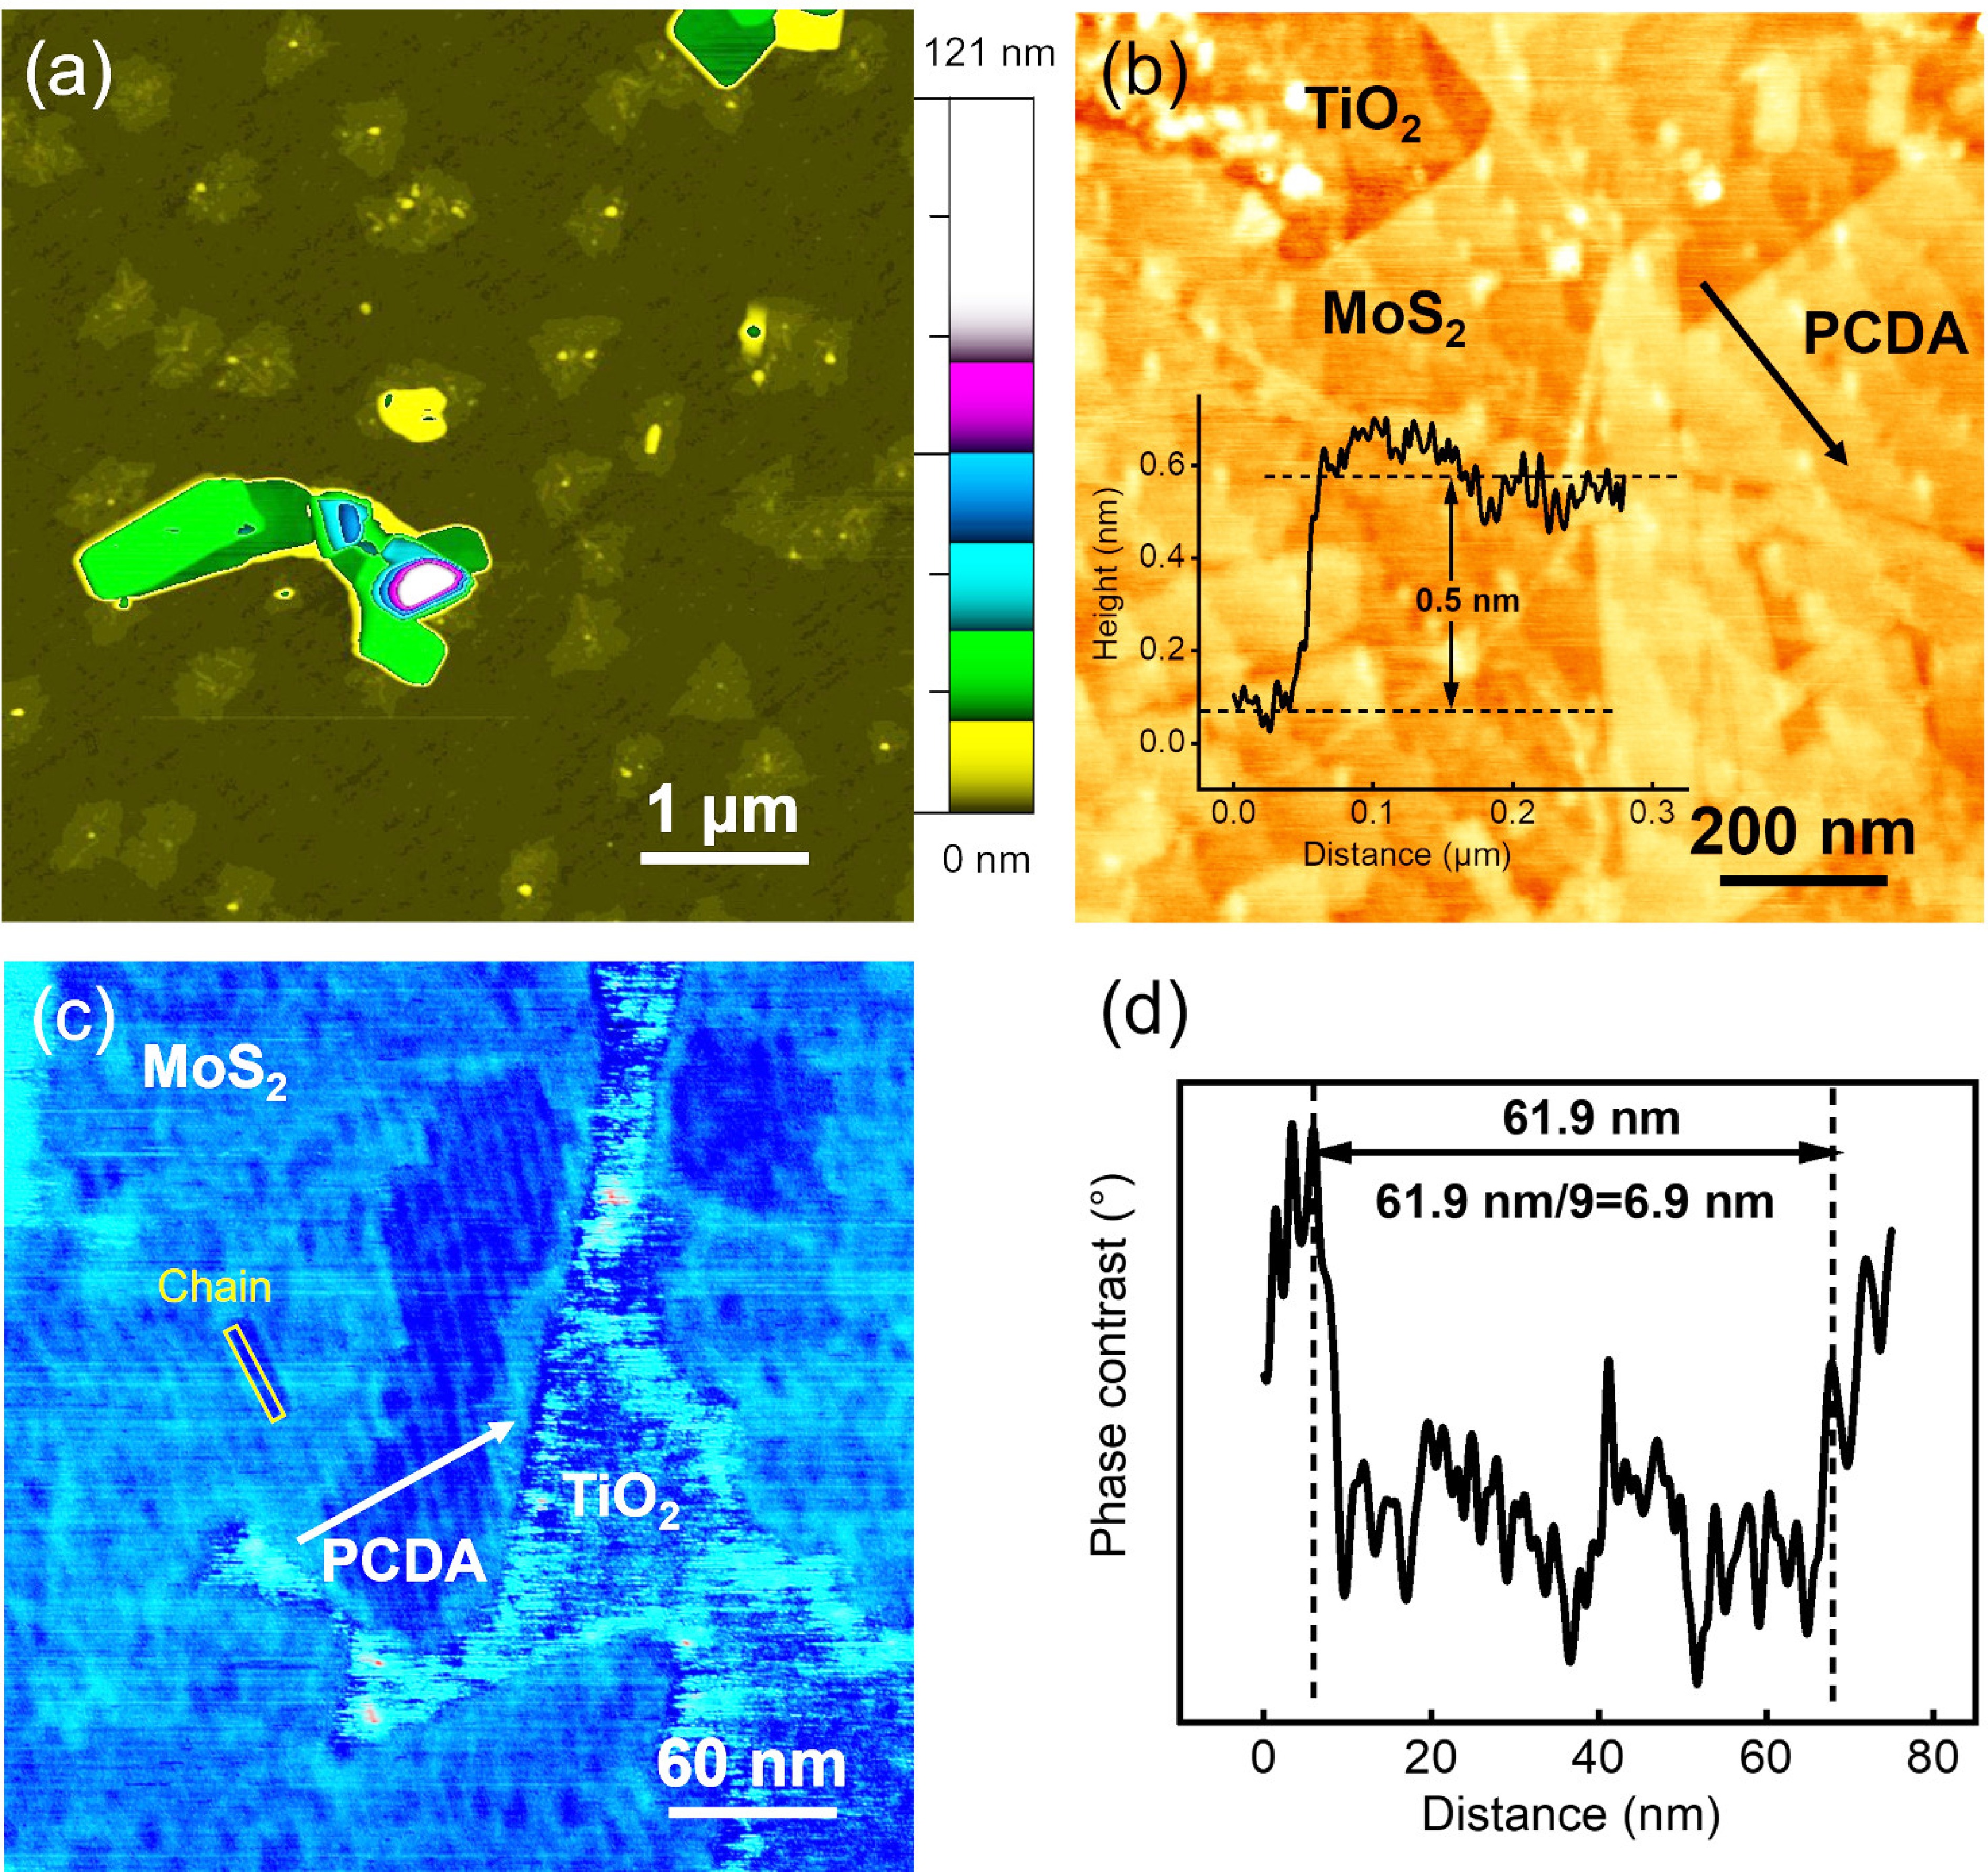
![]() AFM characterization of the assembly structure of PCDA on the MoS2/TiO2 surface. (a) Large-area topographic image showing the PCDA aggregates formed on the MoS2/TiO2 surface. (b) Zoomed-in topographic image focusing on the MoS2/TiO2 region covered by PCDA film. (c) Zoomed-in phase image showing the resolved assembly structure of PCDA on MoS2/TiO2. (d) Section profile taken along the white arrow in (c), which measures the periodicity of the PCDA assembly as ~6.9 nm.
AFM characterization of the assembly structure of PCDA on the MoS2/TiO2 surface. (a) Large-area topographic image showing the PCDA aggregates formed on the MoS2/TiO2 surface. (b) Zoomed-in topographic image focusing on the MoS2/TiO2 region covered by PCDA film. (c) Zoomed-in phase image showing the resolved assembly structure of PCDA on MoS2/TiO2. (d) Section profile taken along the white arrow in (c), which measures the periodicity of the PCDA assembly as ~6.9 nm.
-
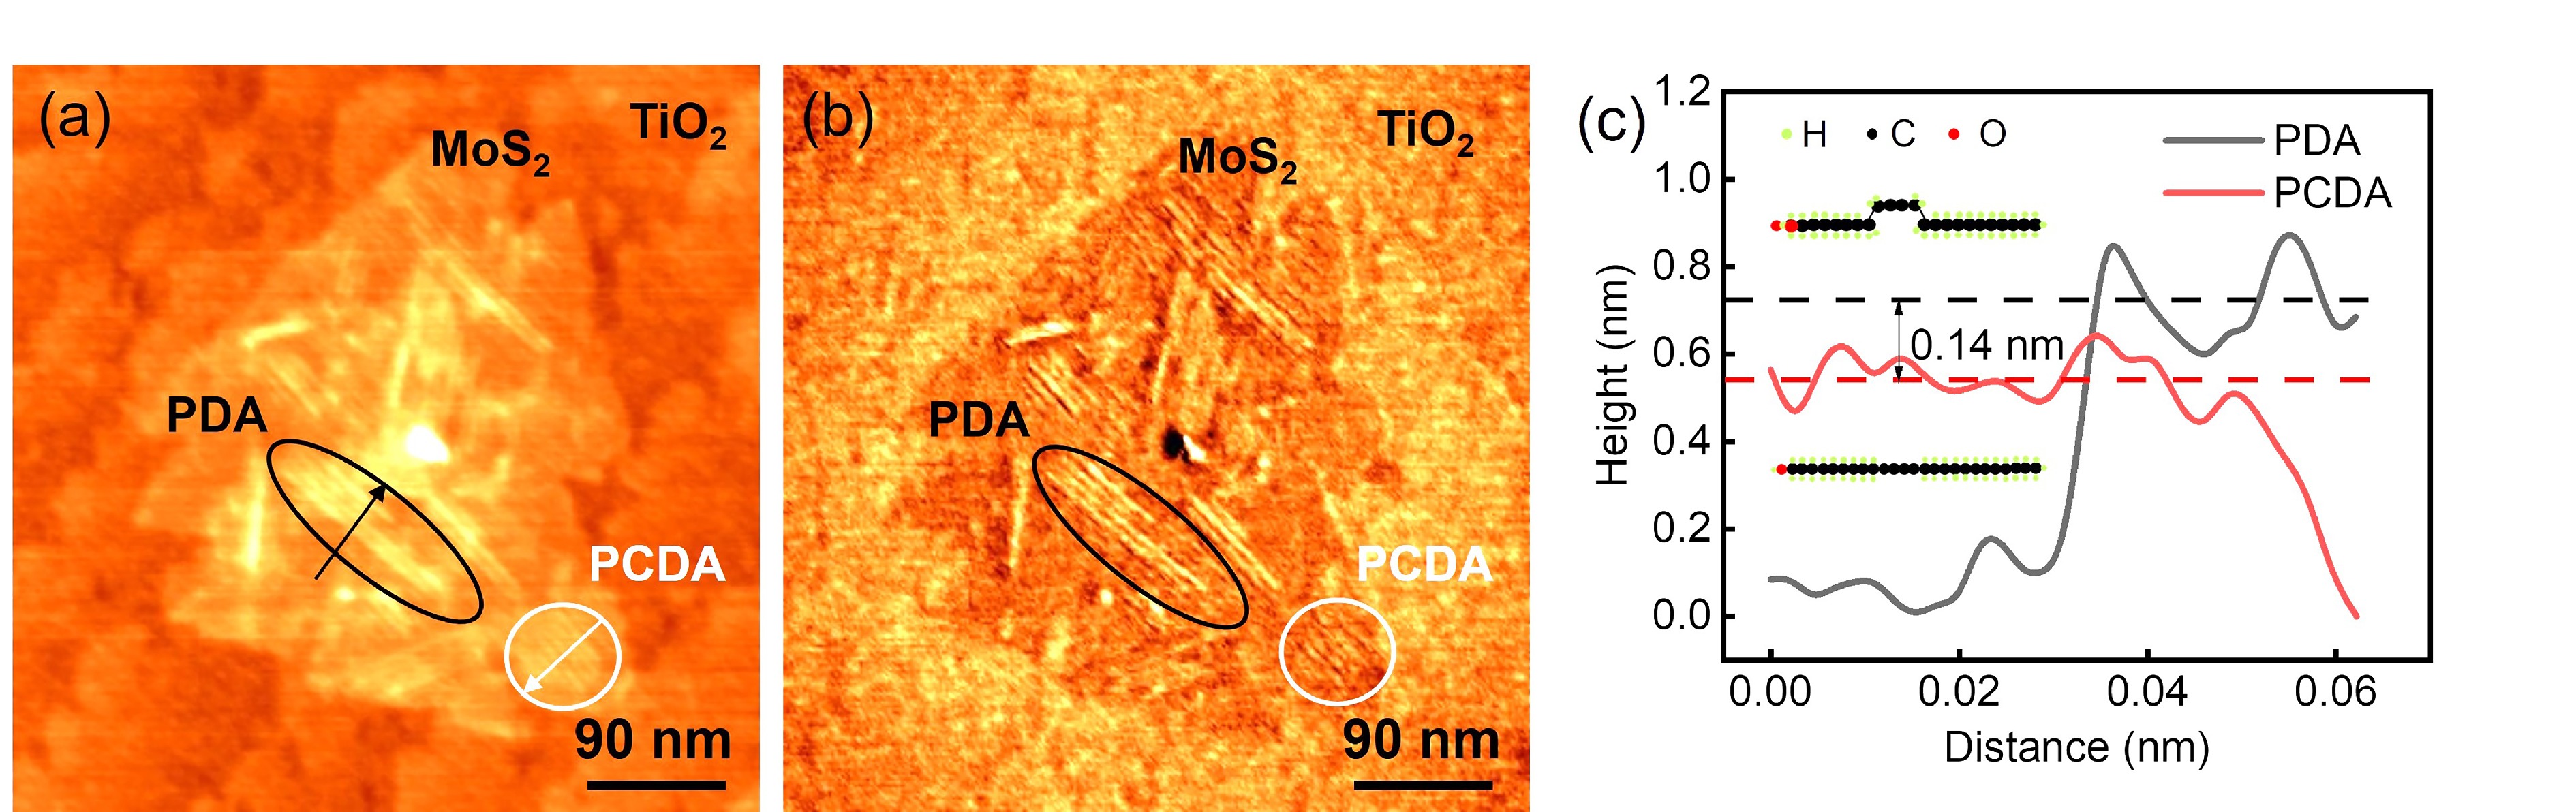
![]() (a) AFM topography and (b) the corresponding phase images of the PCDA/MoS2/TiO2 surface after UV irradiation. The black and red ovals highlight the polymerized and unreacted PCDA assembly, respectively. (c) Section profiles taken along the black and red arrows in (a), showing the height difference between the reacted and unreacted PCDA film. Inserted are the simple schematics for the flat lying PCDA (lower) and the PDA polymer (upper), respectively.
(a) AFM topography and (b) the corresponding phase images of the PCDA/MoS2/TiO2 surface after UV irradiation. The black and red ovals highlight the polymerized and unreacted PCDA assembly, respectively. (c) Section profiles taken along the black and red arrows in (a), showing the height difference between the reacted and unreacted PCDA film. Inserted are the simple schematics for the flat lying PCDA (lower) and the PDA polymer (upper), respectively.
-
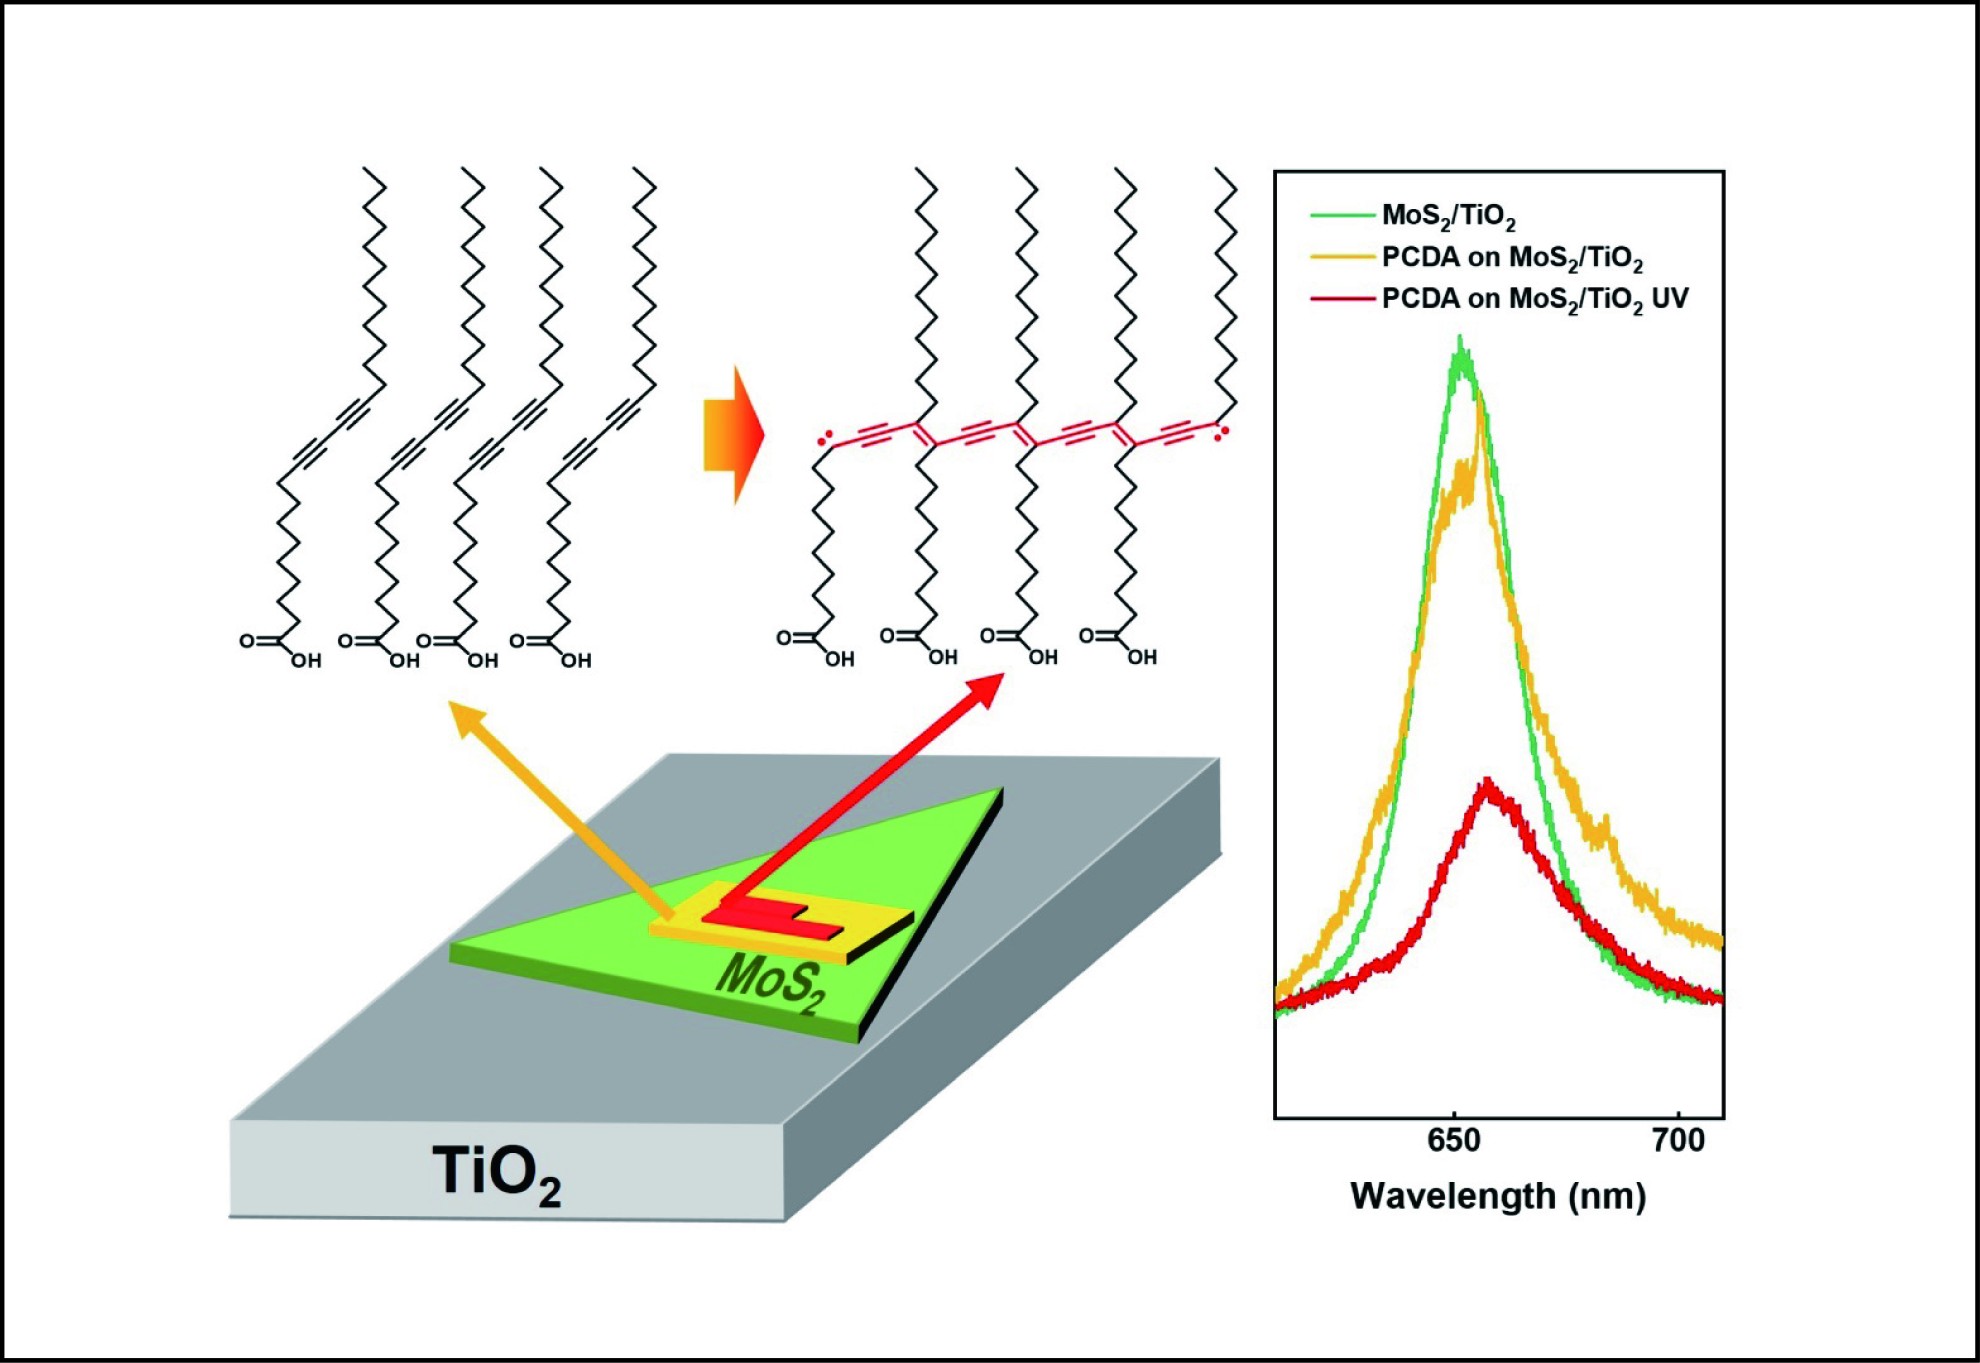
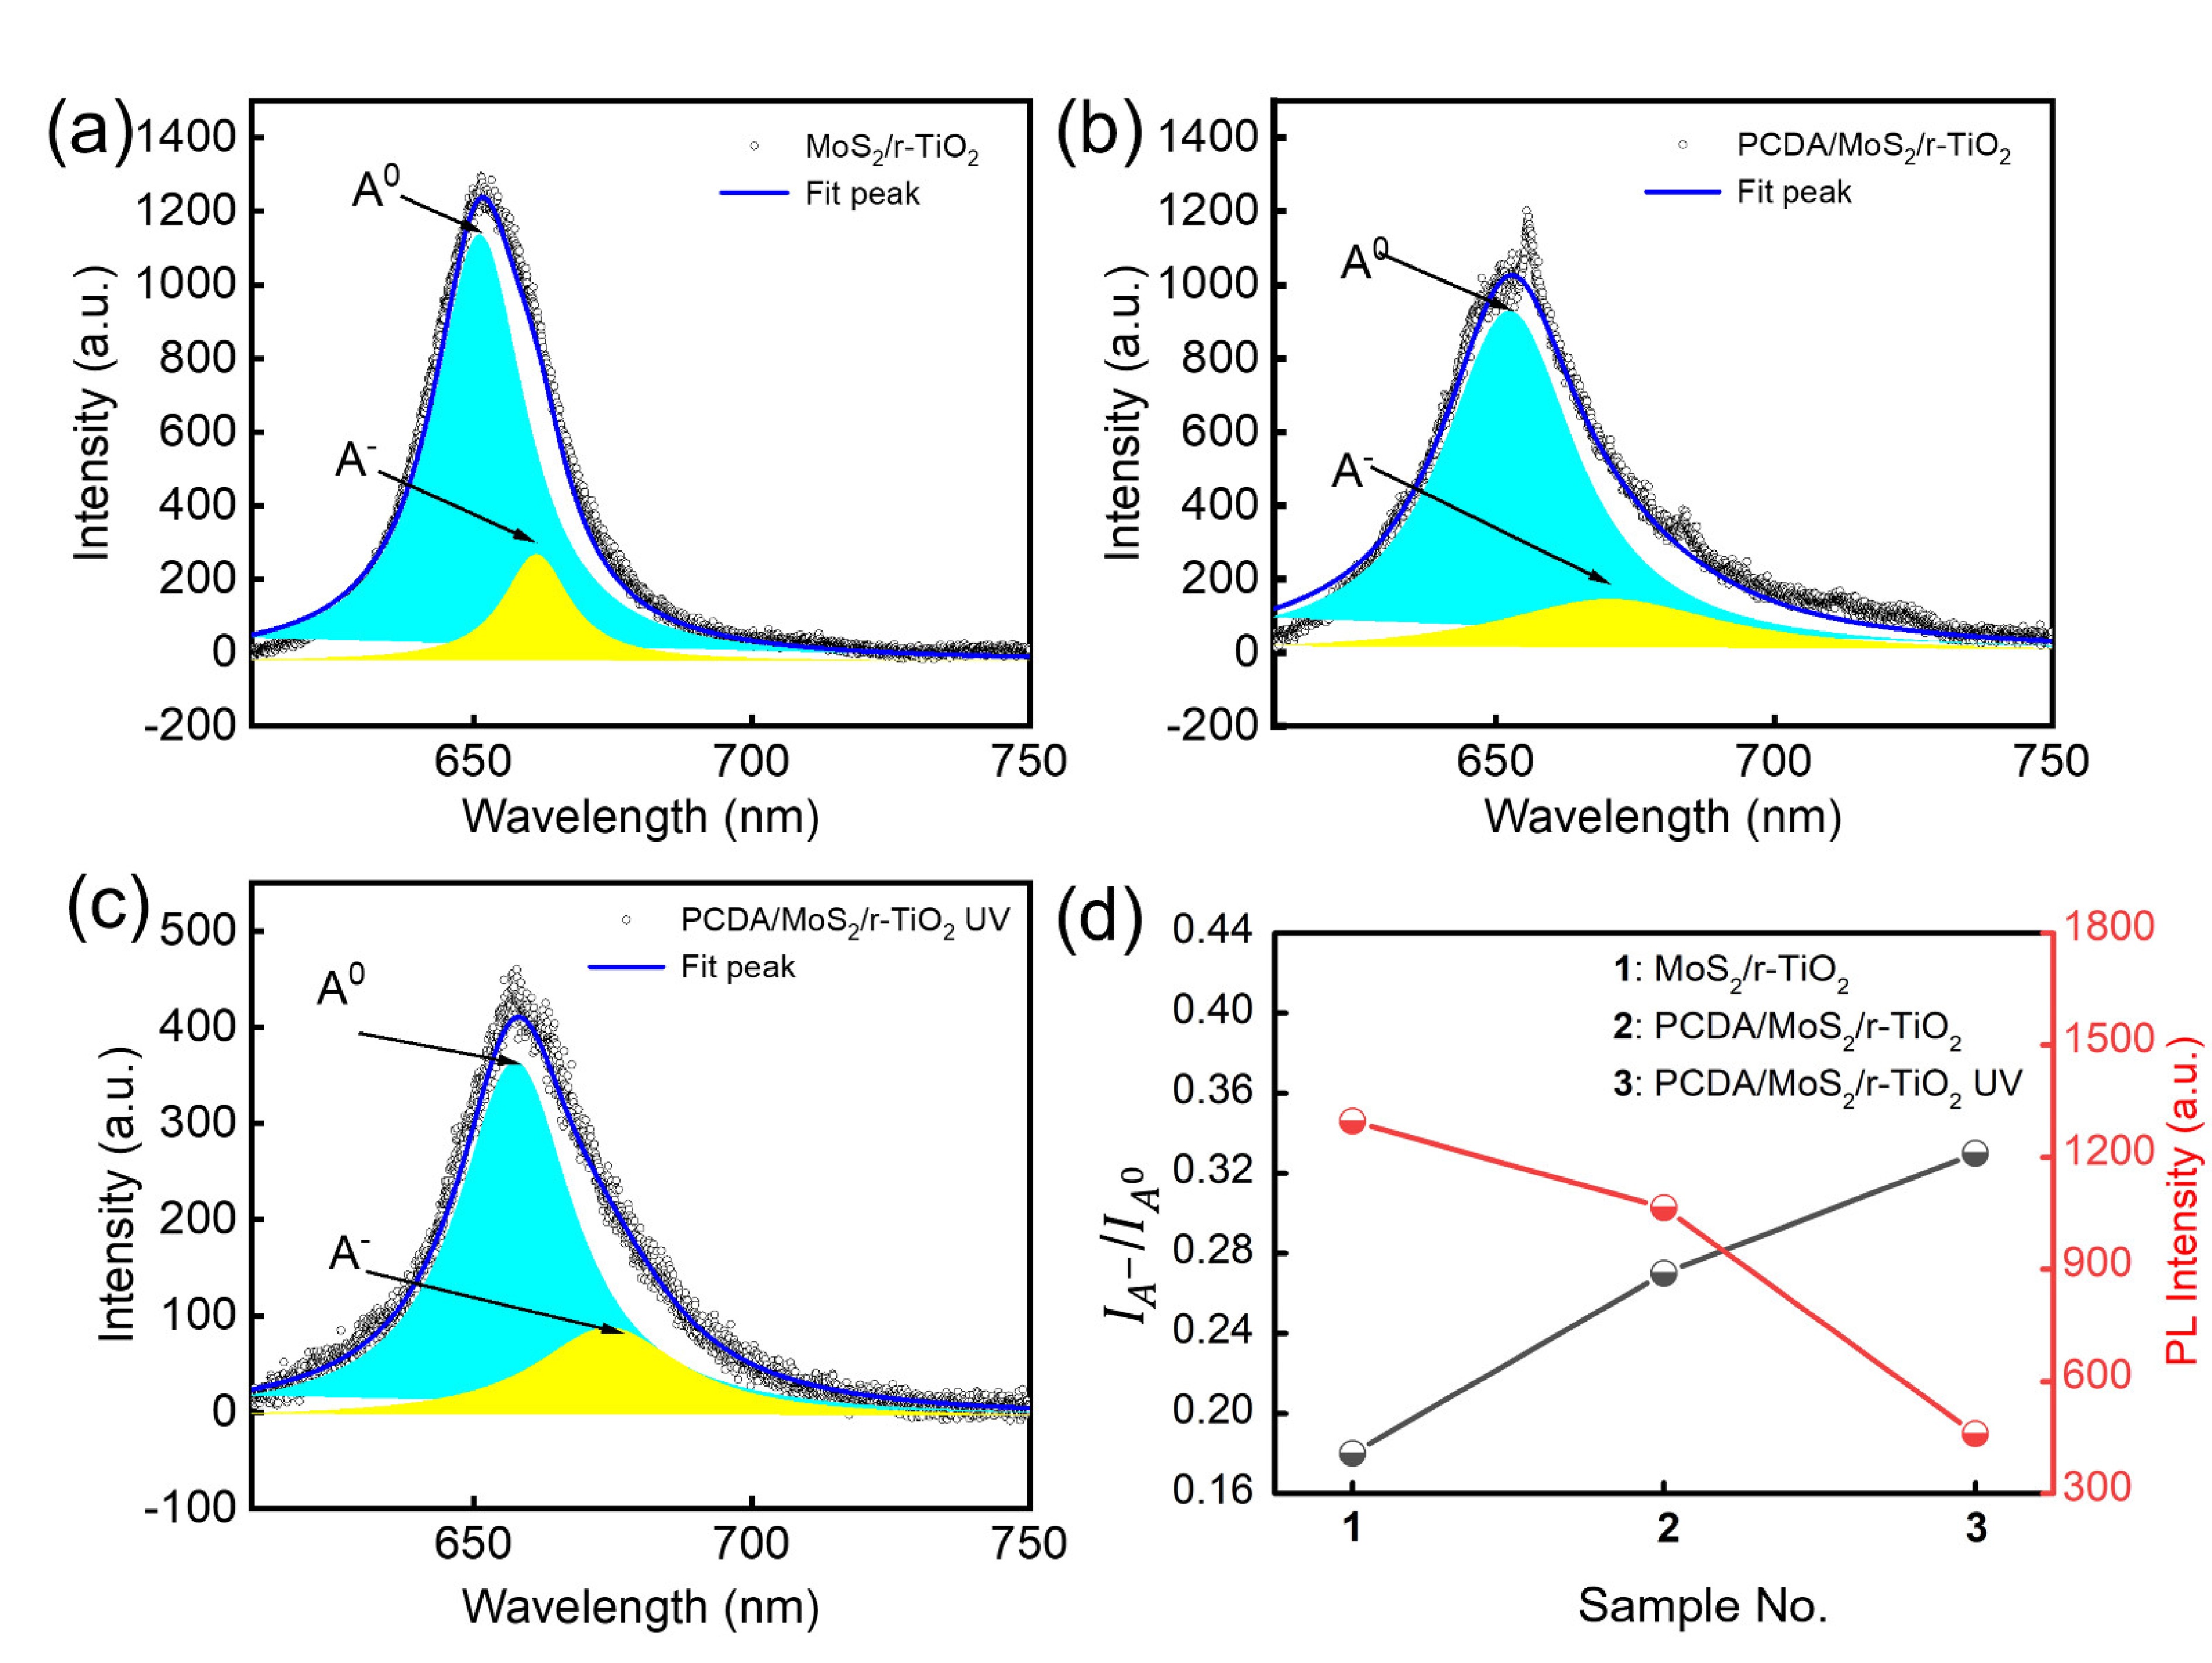
![]() PL spectra measured on the different samples: (a) bare MoS2/TiO2, (b) PCDA/MoS2/TiO2 and (c) PCDA/MoS2/TiO2 structure after UV irradiation. All the spectra are properly fit with two peaks, i.e., A0 and A−. (d) Plot of the PL intensities and the
PL spectra measured on the different samples: (a) bare MoS2/TiO2, (b) PCDA/MoS2/TiO2 and (c) PCDA/MoS2/TiO2 structure after UV irradiation. All the spectra are properly fit with two peaks, i.e., A0 and A−. (d) Plot of the PL intensities and the IA−/IA0 ratios versus different samples.

Related articles
-
2023, 53(8): 0802. DOI: 10.52396/JUSTC-2021-0015
-
2021, 51(12): 912-926. DOI: 10.52396/JUST-2021-0107
-
2020, 50(2): 197-207. DOI: 10.3969/j.issn.0253-2778.2020.02.015
-
2018, 48(10): 862-867. DOI: 10.3969/j.issn.0253-2778.2018.10.013
-
2017, 47(7): 547-555. DOI: 10.3969/j.issn.0253-2778.2017.07.002
-
2016, 46(9): 780-787. DOI: 10.3969/j.issn.0253-2778.2016.09.010
-
2016, 46(1): 47-55. DOI: 10.3969/j.issn.0253-2778.2016.01.007
-
2015, 45(4): 337-344. DOI: 10.3969/j.issn.0253-2778.2015.04.012
-
2013, 43(8): 639-644. DOI: 10.3969/j.issn.0253-2778.2013.08.006
-
2013, 43(5): 363-368. DOI: 10.3969/j.issn.0253-2778.2013.05.003
