 Download:
Figures of the Article
-
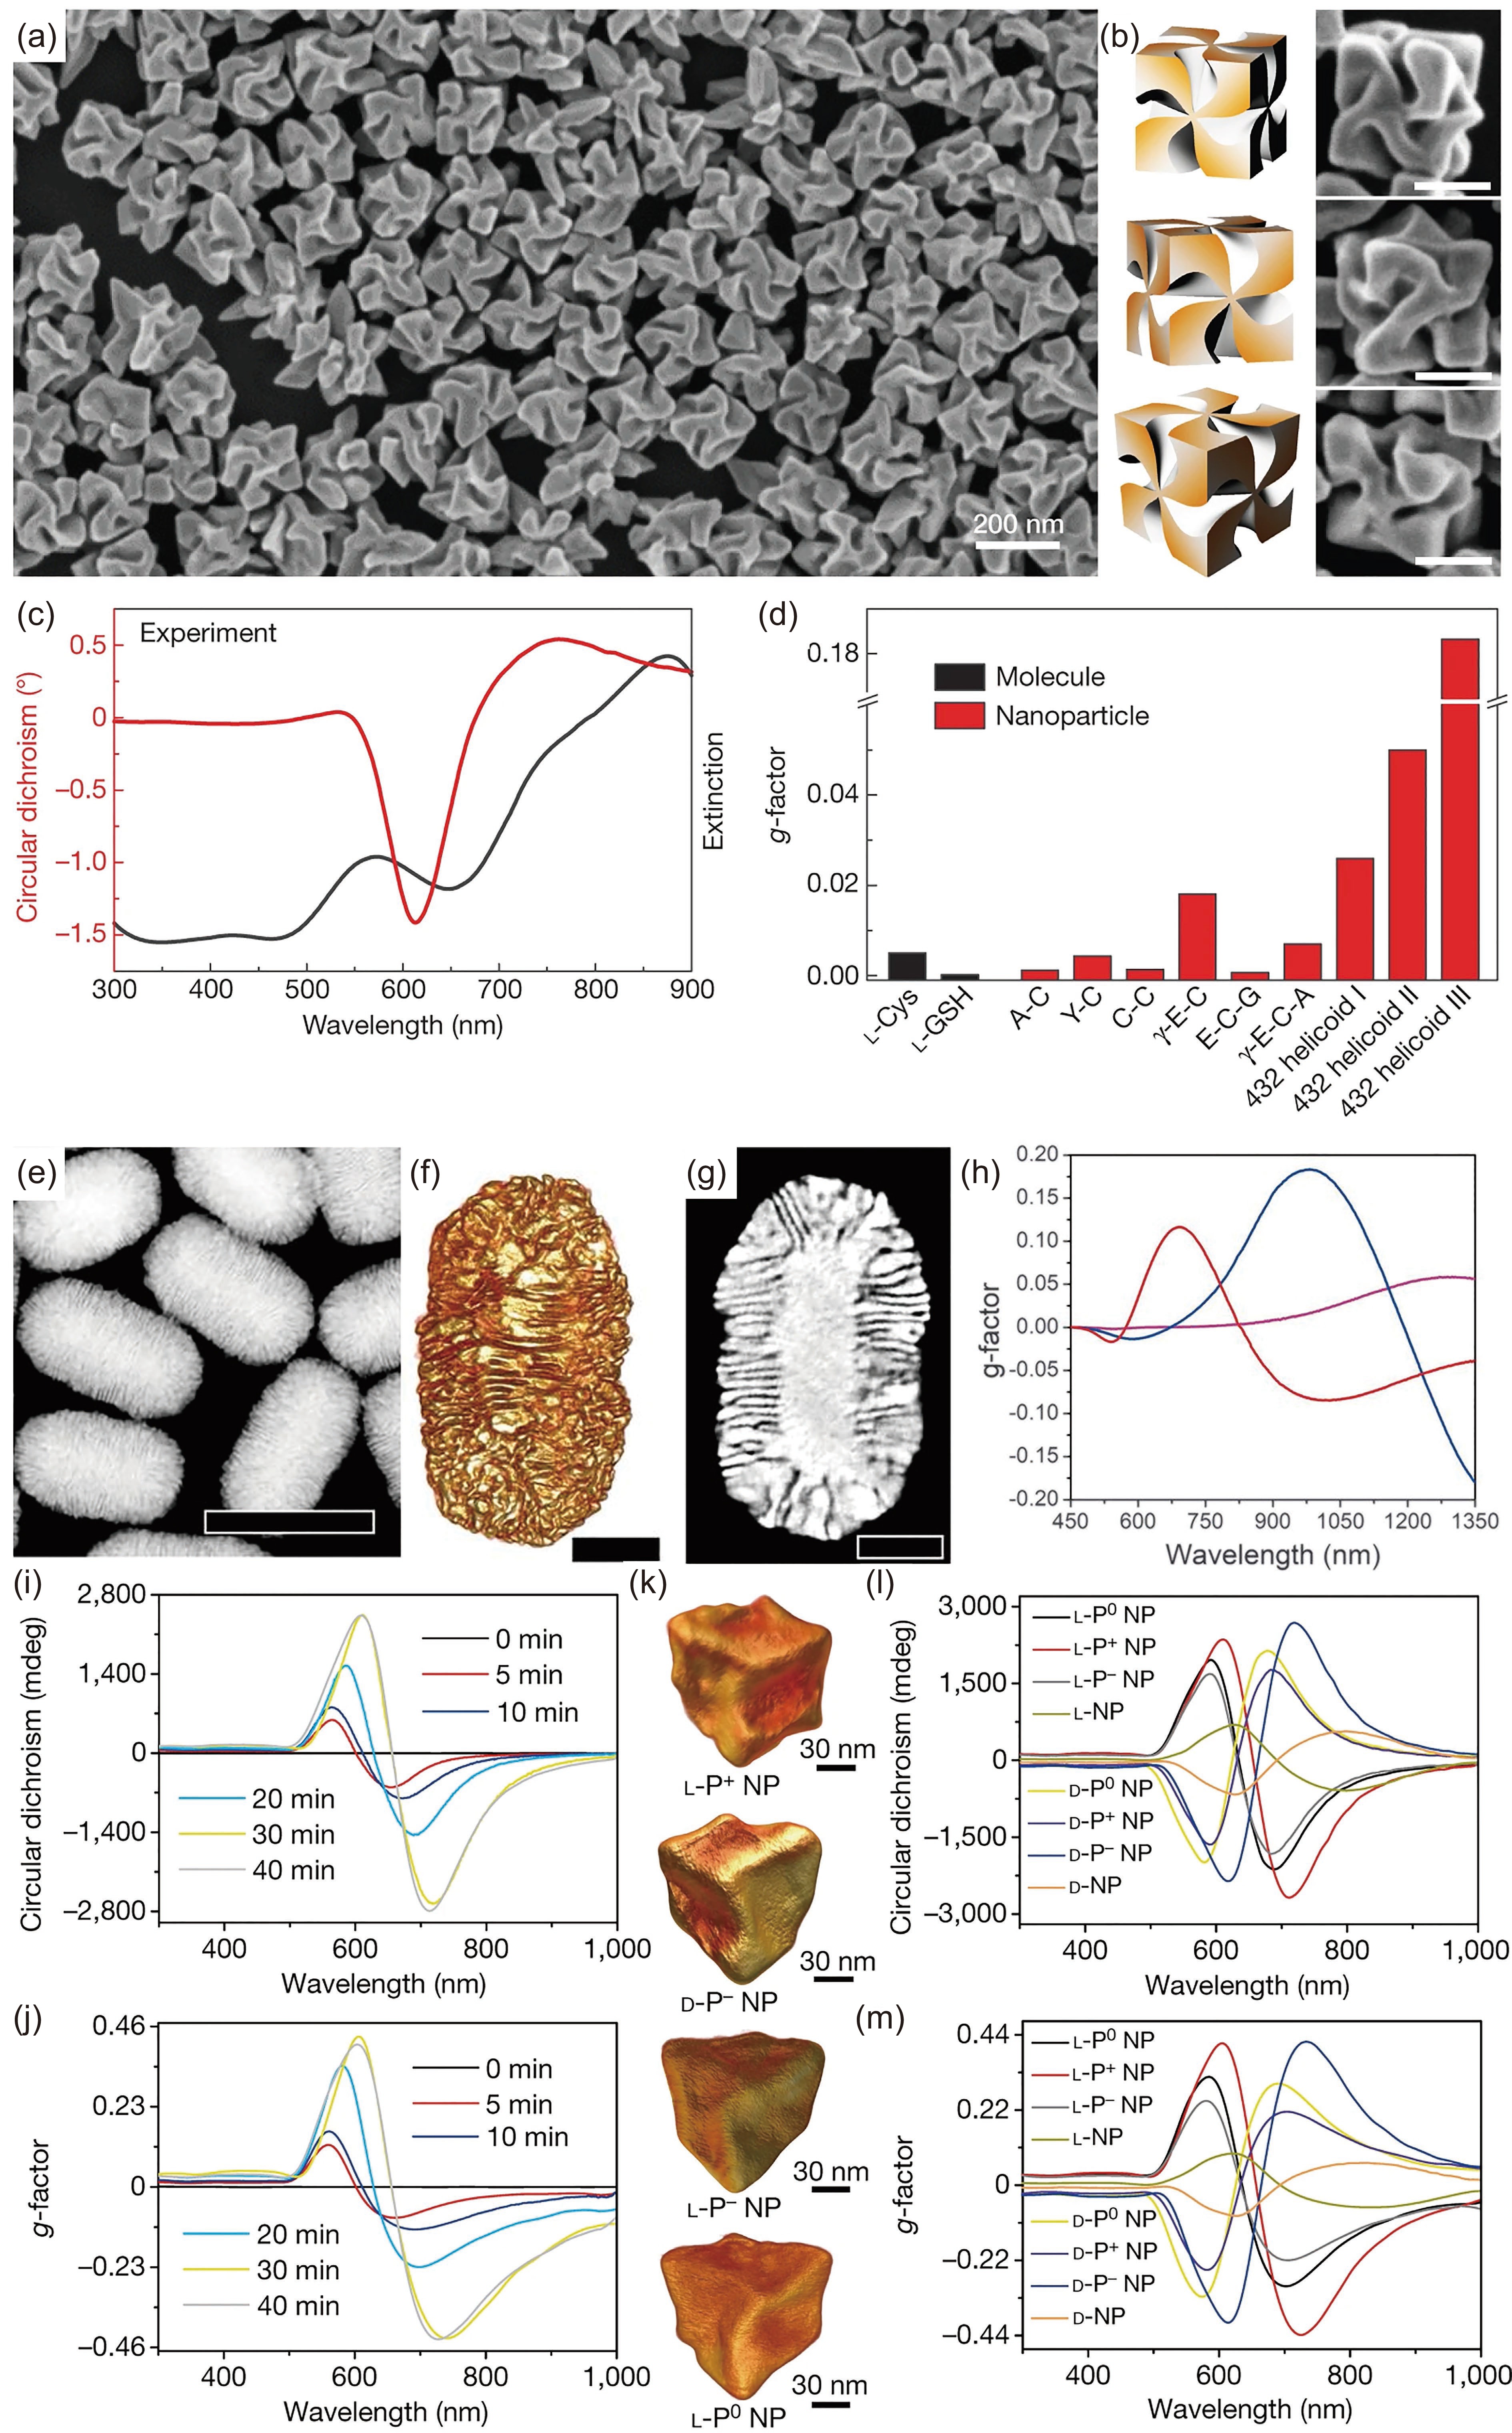
![]() (a) SEM image, (b) 3D models and corresponding SEM images (scale bars: 100 nm), and (c) experimental CD and extinction spectra of 432 helicoid III chiral NPs induced by L-cysteine. (d) g-factor comparison among 432 helicoid III, other NPs, and chiral molecules. Adapted with permission from Ref. [7]. Copyright 2018, Springer Nature. (e) HAADF-STEM image (scale bars: 200 nm), (f) 3D reconstructions (scale bars: 50 nm) and (g) orthoslices (scale bars: 50 nm) of chiral Au NRs. (h) g-factor spectra of chiral Au NRs with different sizes. Adapted with permission from Ref. [23]. Copyright 2020, the American Association for the Advancement of Science. (i) CD and (j) g-factor spectra of L-P+ NPs exposed to laser irradiation for different durations. (k) TEM tomography images of L-P+, D-P−, L-P−, and L-P0 NPs. (l) CD and (m) g-factor spectra of synthesized chiral Au NPs. Adapted with permission from Ref. [16]. Copyright 2022, Springer Nature.
(a) SEM image, (b) 3D models and corresponding SEM images (scale bars: 100 nm), and (c) experimental CD and extinction spectra of 432 helicoid III chiral NPs induced by L-cysteine. (d) g-factor comparison among 432 helicoid III, other NPs, and chiral molecules. Adapted with permission from Ref. [7]. Copyright 2018, Springer Nature. (e) HAADF-STEM image (scale bars: 200 nm), (f) 3D reconstructions (scale bars: 50 nm) and (g) orthoslices (scale bars: 50 nm) of chiral Au NRs. (h) g-factor spectra of chiral Au NRs with different sizes. Adapted with permission from Ref. [23]. Copyright 2020, the American Association for the Advancement of Science. (i) CD and (j) g-factor spectra of L-P+ NPs exposed to laser irradiation for different durations. (k) TEM tomography images of L-P+, D-P−, L-P−, and L-P0 NPs. (l) CD and (m) g-factor spectra of synthesized chiral Au NPs. Adapted with permission from Ref. [16]. Copyright 2022, Springer Nature.
-
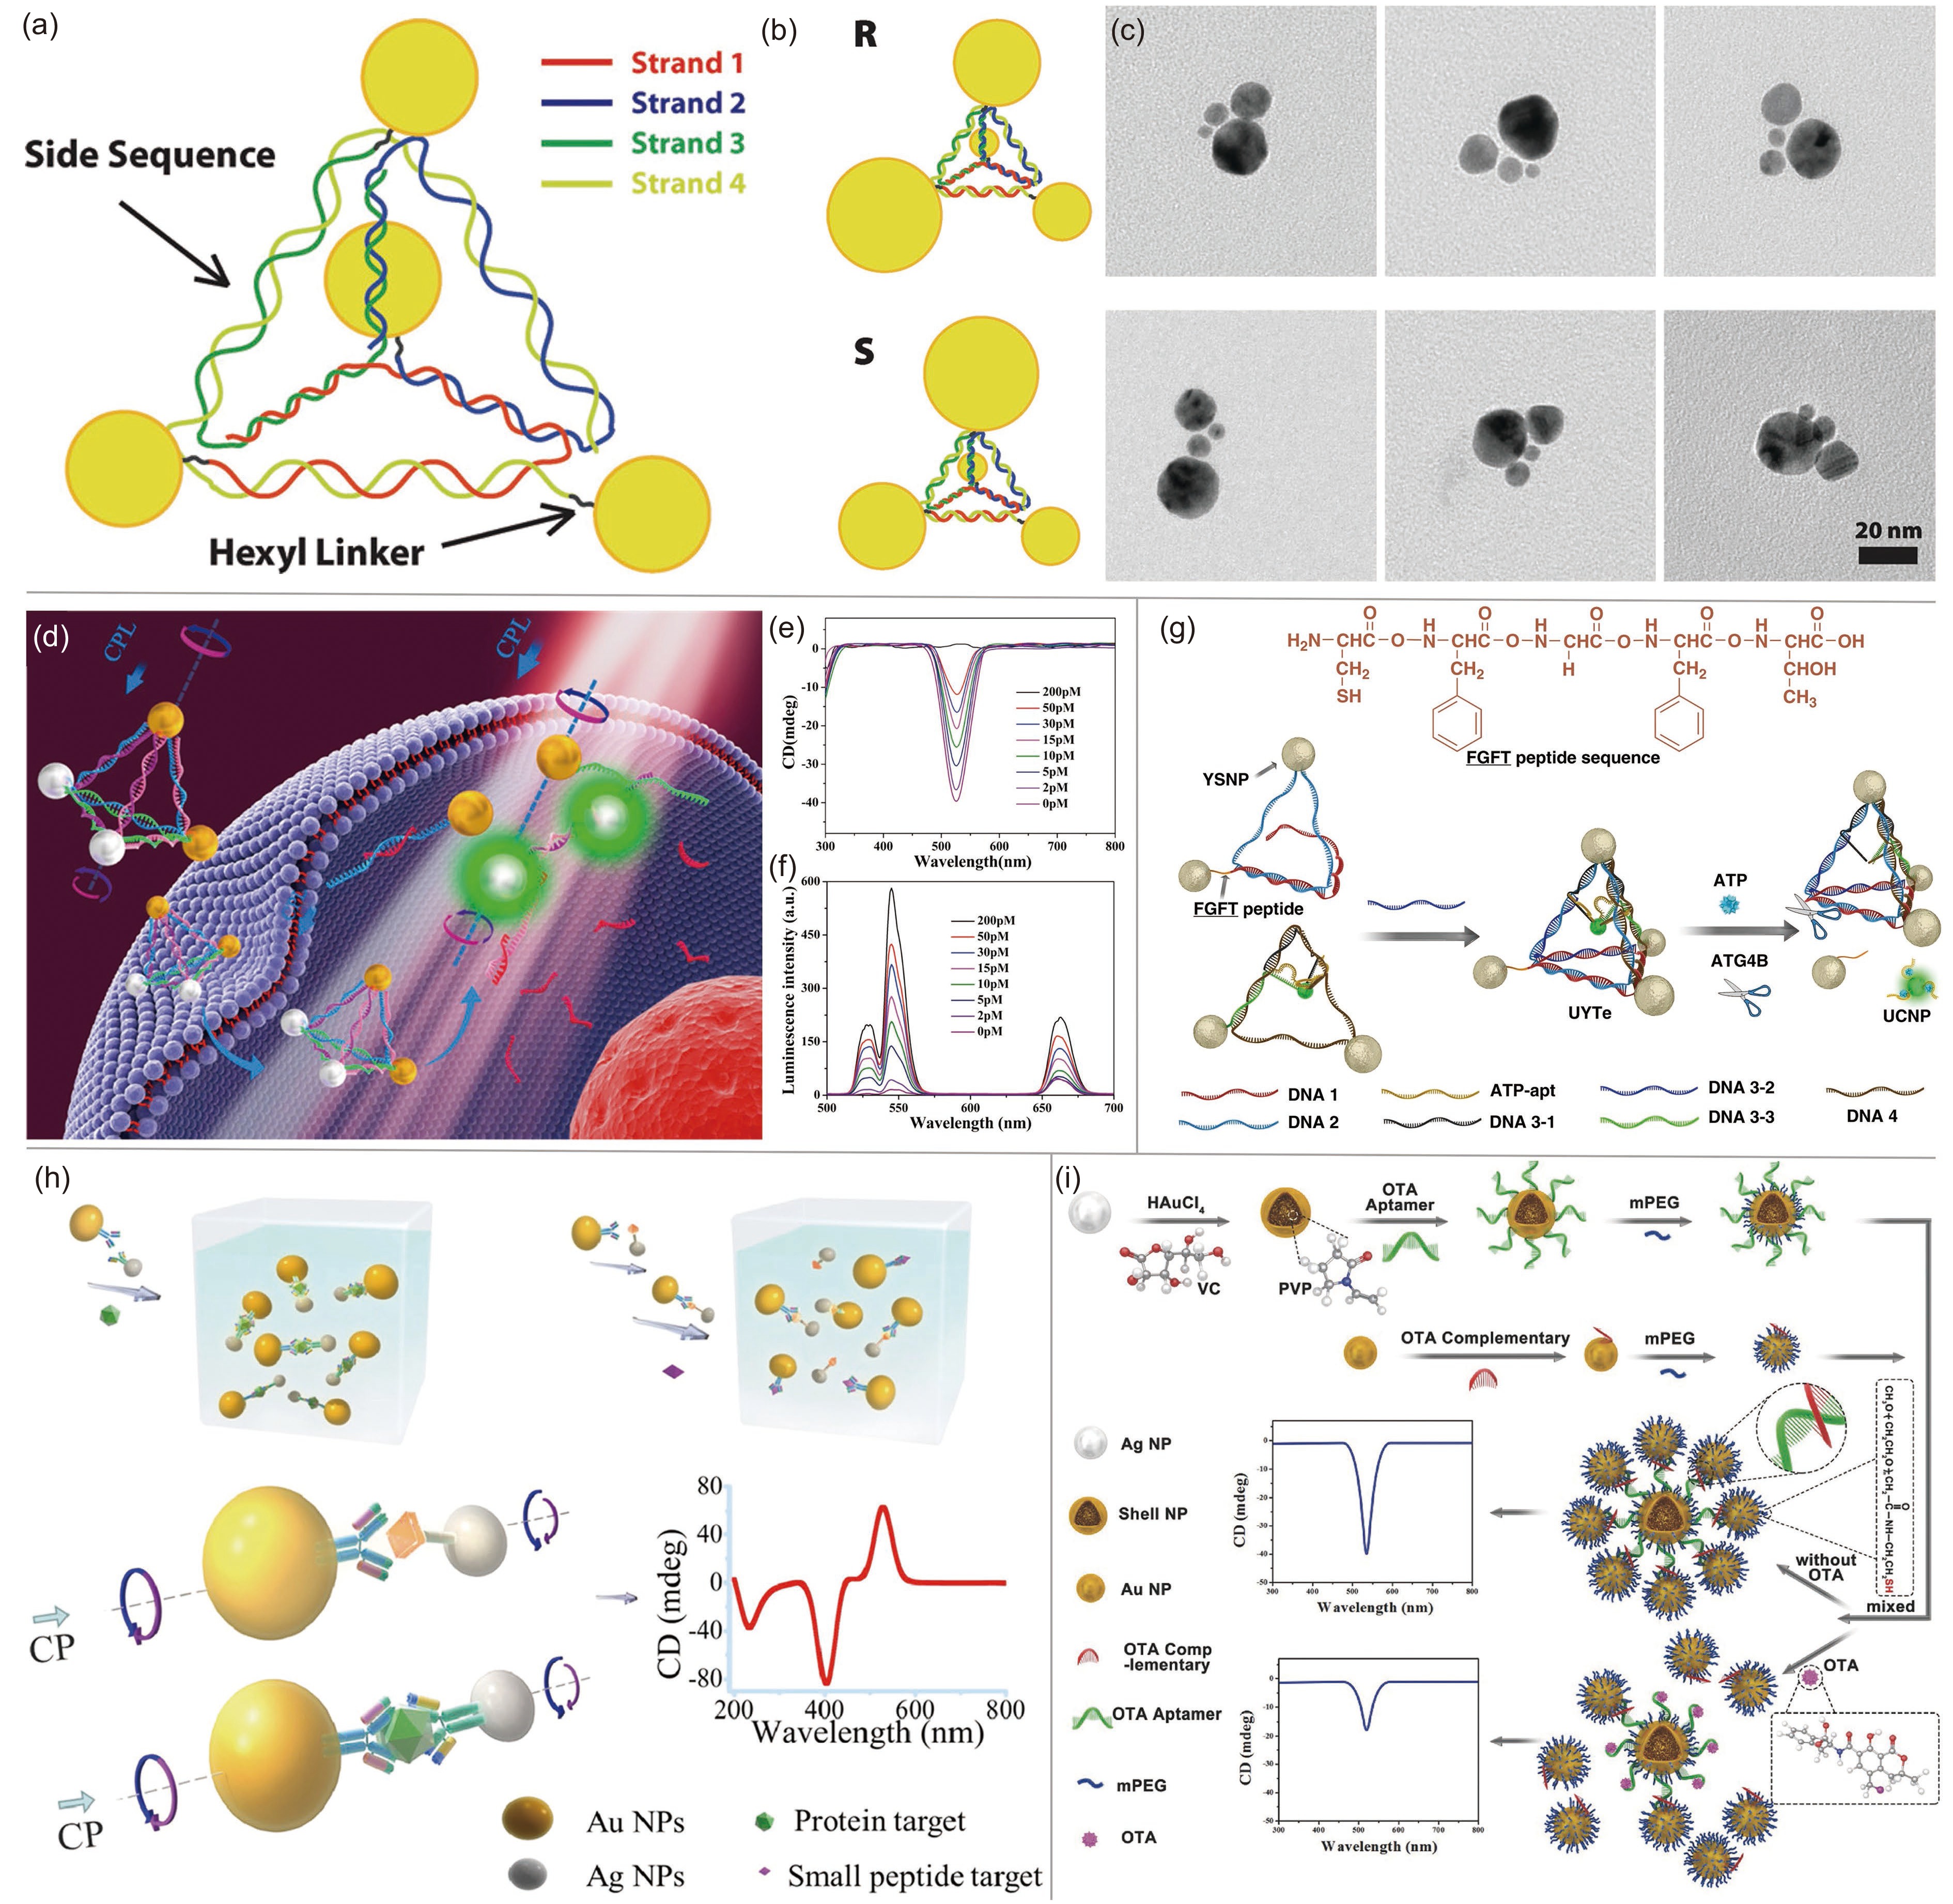
![]() (a) Structure of DNA-nanocrystal pyramids. (b) Schematic and (c) TEM images of chiral pyramids. Top row, R; bottom row, S. Adapted with permission from Ref. [40]. Copyright 2009, American Chemical Society. (d) Schematic illustration of the Au-UCNP pyramids for microRNA detection. (e) CD and (f) luminescence spectra of Au-UCNP pyramids. Adapted with permission from Ref. [33]. Copyright 2016, American Chemical Society. (g) Tetrahedron NPs centralized with UCNPs. Adapted with permission from Ref. [34]. Copyright 2018, American Chemical Society. (h) Schematic illustration of nanoparticle heterodimer assembly and its application in biological analysis. Adapted with permission from Ref. [41]. Copyright 2013, American Chemical Society. (i) Synthesis of shell core–Au satellite and detection of ochratoxin A based on chiral signal. Adapted with permission from Ref. [39]. Copyright 2018, Wiley-VCH.
(a) Structure of DNA-nanocrystal pyramids. (b) Schematic and (c) TEM images of chiral pyramids. Top row, R; bottom row, S. Adapted with permission from Ref. [40]. Copyright 2009, American Chemical Society. (d) Schematic illustration of the Au-UCNP pyramids for microRNA detection. (e) CD and (f) luminescence spectra of Au-UCNP pyramids. Adapted with permission from Ref. [33]. Copyright 2016, American Chemical Society. (g) Tetrahedron NPs centralized with UCNPs. Adapted with permission from Ref. [34]. Copyright 2018, American Chemical Society. (h) Schematic illustration of nanoparticle heterodimer assembly and its application in biological analysis. Adapted with permission from Ref. [41]. Copyright 2013, American Chemical Society. (i) Synthesis of shell core–Au satellite and detection of ochratoxin A based on chiral signal. Adapted with permission from Ref. [39]. Copyright 2018, Wiley-VCH.
-
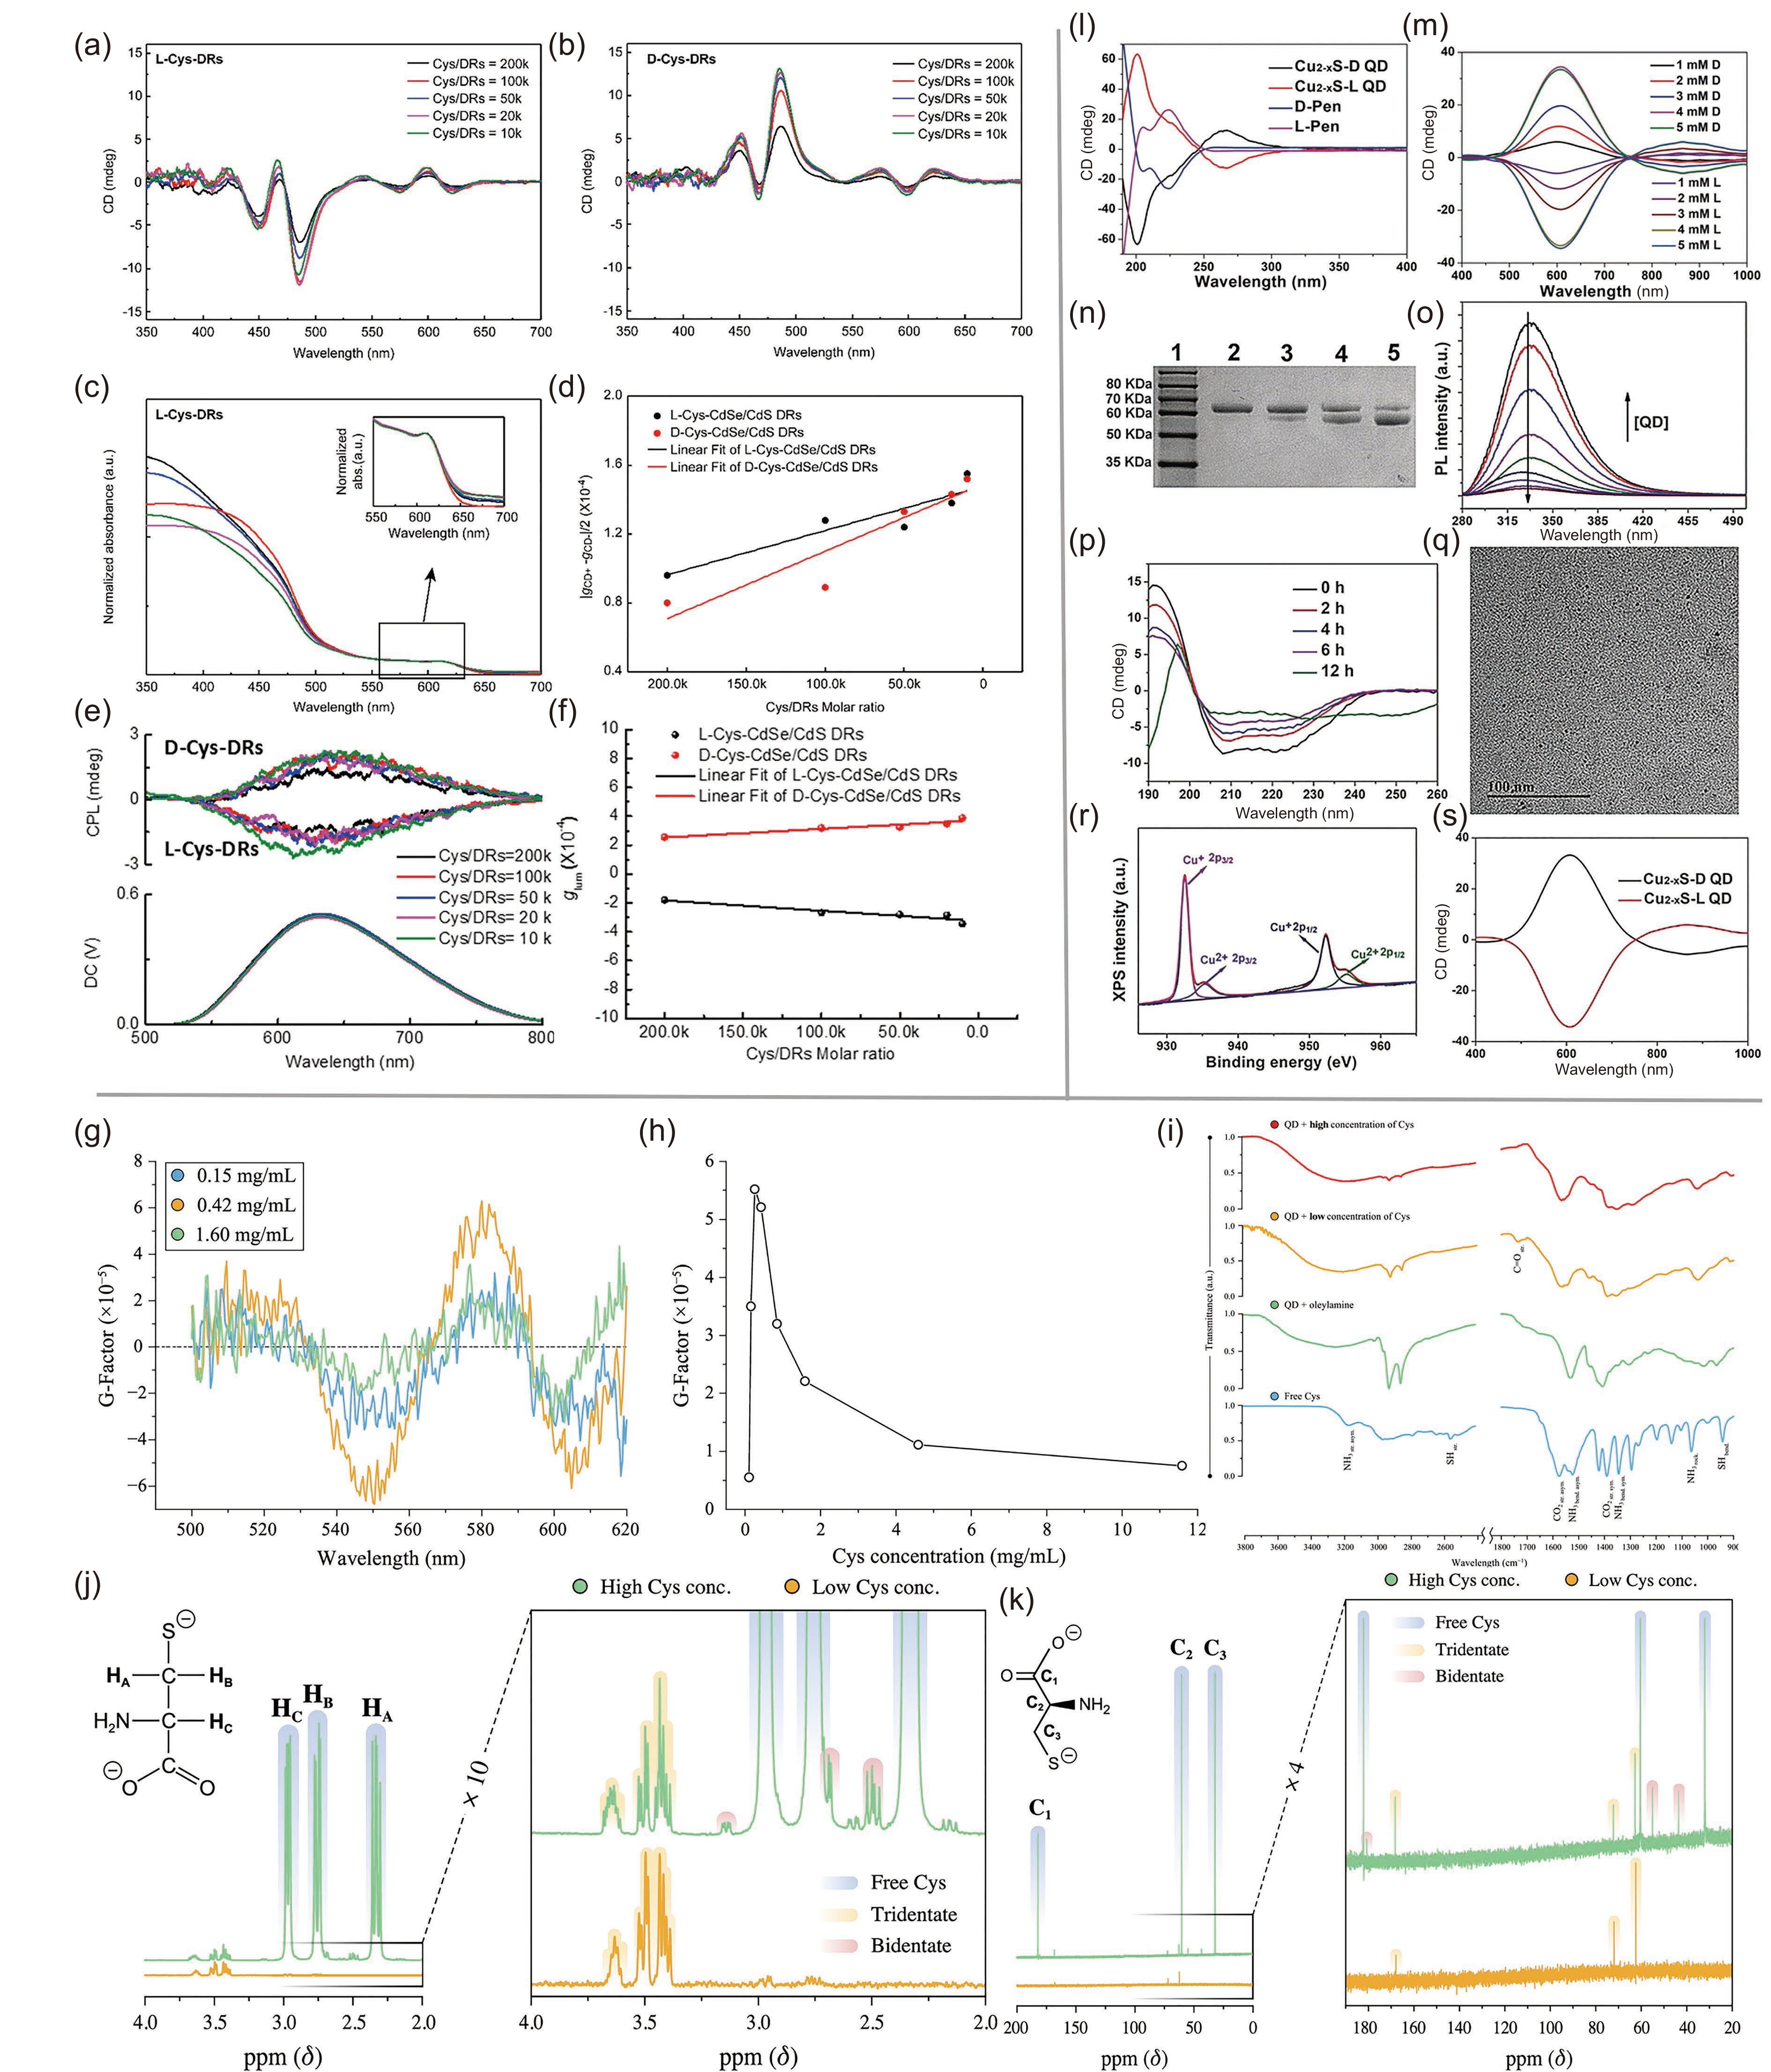
![]() (a) CD spectra of L-cysteine-DRs and (b) D-cysteine-DRs. (c) UV/vis spectra of L-cysteine-DRs with different cysteine/DR ratios. (d) Illustration of the relationship between the g-factor of CdSe/Cds DRs and the ratio of cysteine/DRs. (e) CPL spectra and (f) glum values of L- and D-cysteine-DRs with different cysteine/DR ratios. Adapted with permission from Ref. [46]. Copyright 2018, American Chemical Society. (g) glum of chiral CdSe/CdS QDs with different concentrations of cysteine. (h) The relationship between glum and the concentration of cysteine at 605 nm. (i) FTIR spectra of QDs and QDs with cysteine or organic ligands. (j) 1H NMR spectra and (k) 13C NMR spectra of QDs. Adapted with permission from Ref. [47]. Copyright 2019, American Chemical Society. (l) CD spectra of L-/D-pen and the chiral QDs. (m) CD spectra of QDs with various concentrations of chiral Pen. (n) Illustration of the influence of L-QDs on the cleavage of BSA under different light conditions. Lane 1, molecular marker; lane 2, BSA; lane 3, BSA + RCP; lane 4, BSA + LP; lane 5, BSA + LCP. (o) PL spectra of BSA with different concentrations of L-QDs. (p) CD spectra of photolysis of BSA at different reaction times. (q) TEM image of L-QDs after interacting with BSA. (r) XPS Cu 2p spectrum of l-QDs after the reaction. (s) CD spectra of the QDs after the cleavage reaction. Adapted with permission from Ref. [48]. Copyright 2019, Wiley-VCH.
(a) CD spectra of L-cysteine-DRs and (b) D-cysteine-DRs. (c) UV/vis spectra of L-cysteine-DRs with different cysteine/DR ratios. (d) Illustration of the relationship between the g-factor of CdSe/Cds DRs and the ratio of cysteine/DRs. (e) CPL spectra and (f) glum values of L- and D-cysteine-DRs with different cysteine/DR ratios. Adapted with permission from Ref. [46]. Copyright 2018, American Chemical Society. (g) glum of chiral CdSe/CdS QDs with different concentrations of cysteine. (h) The relationship between glum and the concentration of cysteine at 605 nm. (i) FTIR spectra of QDs and QDs with cysteine or organic ligands. (j) 1H NMR spectra and (k) 13C NMR spectra of QDs. Adapted with permission from Ref. [47]. Copyright 2019, American Chemical Society. (l) CD spectra of L-/D-pen and the chiral QDs. (m) CD spectra of QDs with various concentrations of chiral Pen. (n) Illustration of the influence of L-QDs on the cleavage of BSA under different light conditions. Lane 1, molecular marker; lane 2, BSA; lane 3, BSA + RCP; lane 4, BSA + LP; lane 5, BSA + LCP. (o) PL spectra of BSA with different concentrations of L-QDs. (p) CD spectra of photolysis of BSA at different reaction times. (q) TEM image of L-QDs after interacting with BSA. (r) XPS Cu 2p spectrum of l-QDs after the reaction. (s) CD spectra of the QDs after the cleavage reaction. Adapted with permission from Ref. [48]. Copyright 2019, Wiley-VCH.
-
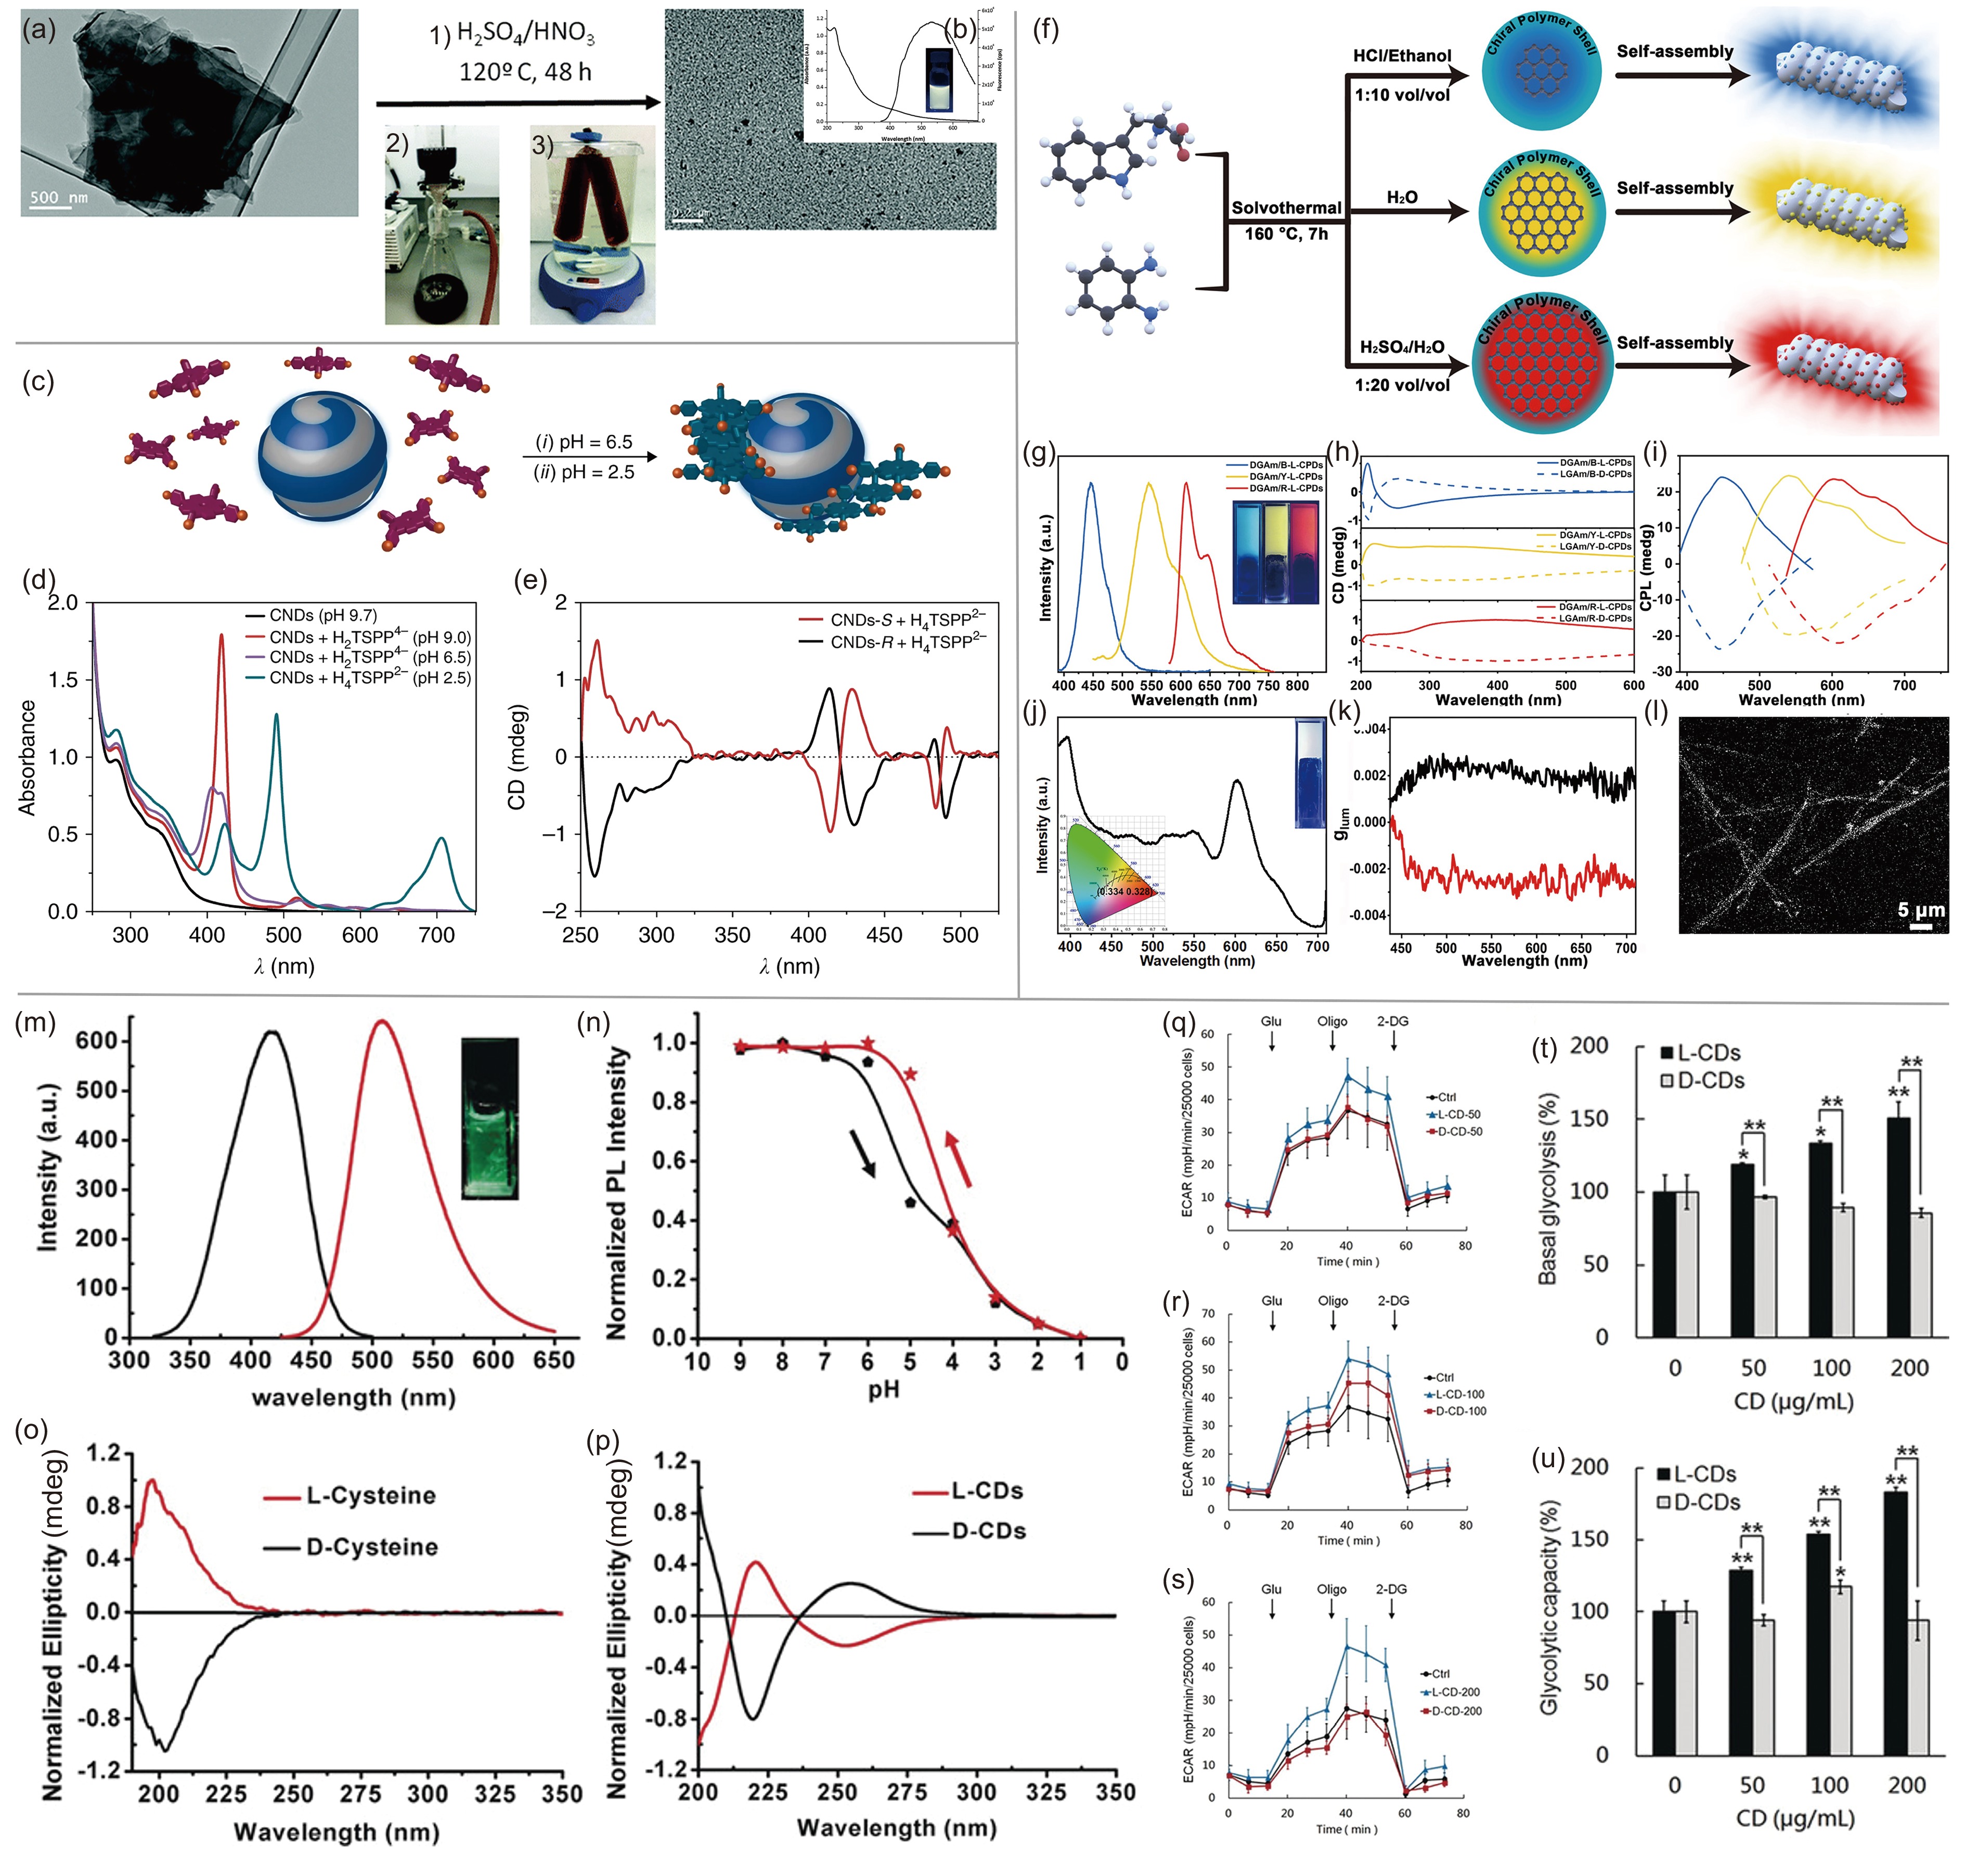
![]() (a) Illustration of the fabrication of chiral GQDs by a three-step approach. (b) UV‒vis and FL spectra of GQDs. Adapted with permission from Ref. [50]. Copyright 2016, the Royal Society of Chemistry. (c) Illustration of chiral CDs as supramolecular templates. (d) UV‒vis spectra of CDs and CDs with HnTSPPm- at different pH values. (e) ECD spectra of L- and D-CDs with HnTSPPm-. Adapted with permission from Ref. [51]. Copyright 2018, Springer Nature. (f) Illustration of the preparation approach for multicolor-emitting chiral CDs. (g) PL spectra of the three types of CDs. (h) CD spectra and (i) CPL of the three CDs capped with gels. (j) Illustration of the CIE value of white PL. (k) glum values of L- and D-CDs. (l) Laser scanning confocal microscope image of white luminescent colloid. Adapted with permission from Ref. [52]. Copyright 2021, Wiley-VCH. (m) PL spectra of the excitation spectrum (black line) and emission spectrum (red line) of L-CDs. (n) Illustration of the relationship of the intensity of the L-CD PL emission. (o) CD spectra of L- and D-Cys and (p) L- and D-CDs. (q–u) Illustration of the influence of chiral CDs on mitochondrial respiration on behalf of the oxygen consumption rate (OCR) of T24 cells treated with 50 µg·mL−1 CDs (q), 100 µg·mL−1 CDs (r), 200 µg·mL−1 CDs (s) for 24 h, (t) basal OCR and (u) maximal OCR. Oligo=oligomycin A, FCCP=carbonyl cyanide-4(trifluoromethoxy)phenylhydrazone, AA=antimycin A, Rot=rotenone. Adapted with permission from Ref. [3]. Copyright 2018, Wiley-VCH.
(a) Illustration of the fabrication of chiral GQDs by a three-step approach. (b) UV‒vis and FL spectra of GQDs. Adapted with permission from Ref. [50]. Copyright 2016, the Royal Society of Chemistry. (c) Illustration of chiral CDs as supramolecular templates. (d) UV‒vis spectra of CDs and CDs with HnTSPPm- at different pH values. (e) ECD spectra of L- and D-CDs with HnTSPPm-. Adapted with permission from Ref. [51]. Copyright 2018, Springer Nature. (f) Illustration of the preparation approach for multicolor-emitting chiral CDs. (g) PL spectra of the three types of CDs. (h) CD spectra and (i) CPL of the three CDs capped with gels. (j) Illustration of the CIE value of white PL. (k) glum values of L- and D-CDs. (l) Laser scanning confocal microscope image of white luminescent colloid. Adapted with permission from Ref. [52]. Copyright 2021, Wiley-VCH. (m) PL spectra of the excitation spectrum (black line) and emission spectrum (red line) of L-CDs. (n) Illustration of the relationship of the intensity of the L-CD PL emission. (o) CD spectra of L- and D-Cys and (p) L- and D-CDs. (q–u) Illustration of the influence of chiral CDs on mitochondrial respiration on behalf of the oxygen consumption rate (OCR) of T24 cells treated with 50 µg·mL−1 CDs (q), 100 µg·mL−1 CDs (r), 200 µg·mL−1 CDs (s) for 24 h, (t) basal OCR and (u) maximal OCR. Oligo=oligomycin A, FCCP=carbonyl cyanide-4(trifluoromethoxy)phenylhydrazone, AA=antimycin A, Rot=rotenone. Adapted with permission from Ref. [3]. Copyright 2018, Wiley-VCH.
-
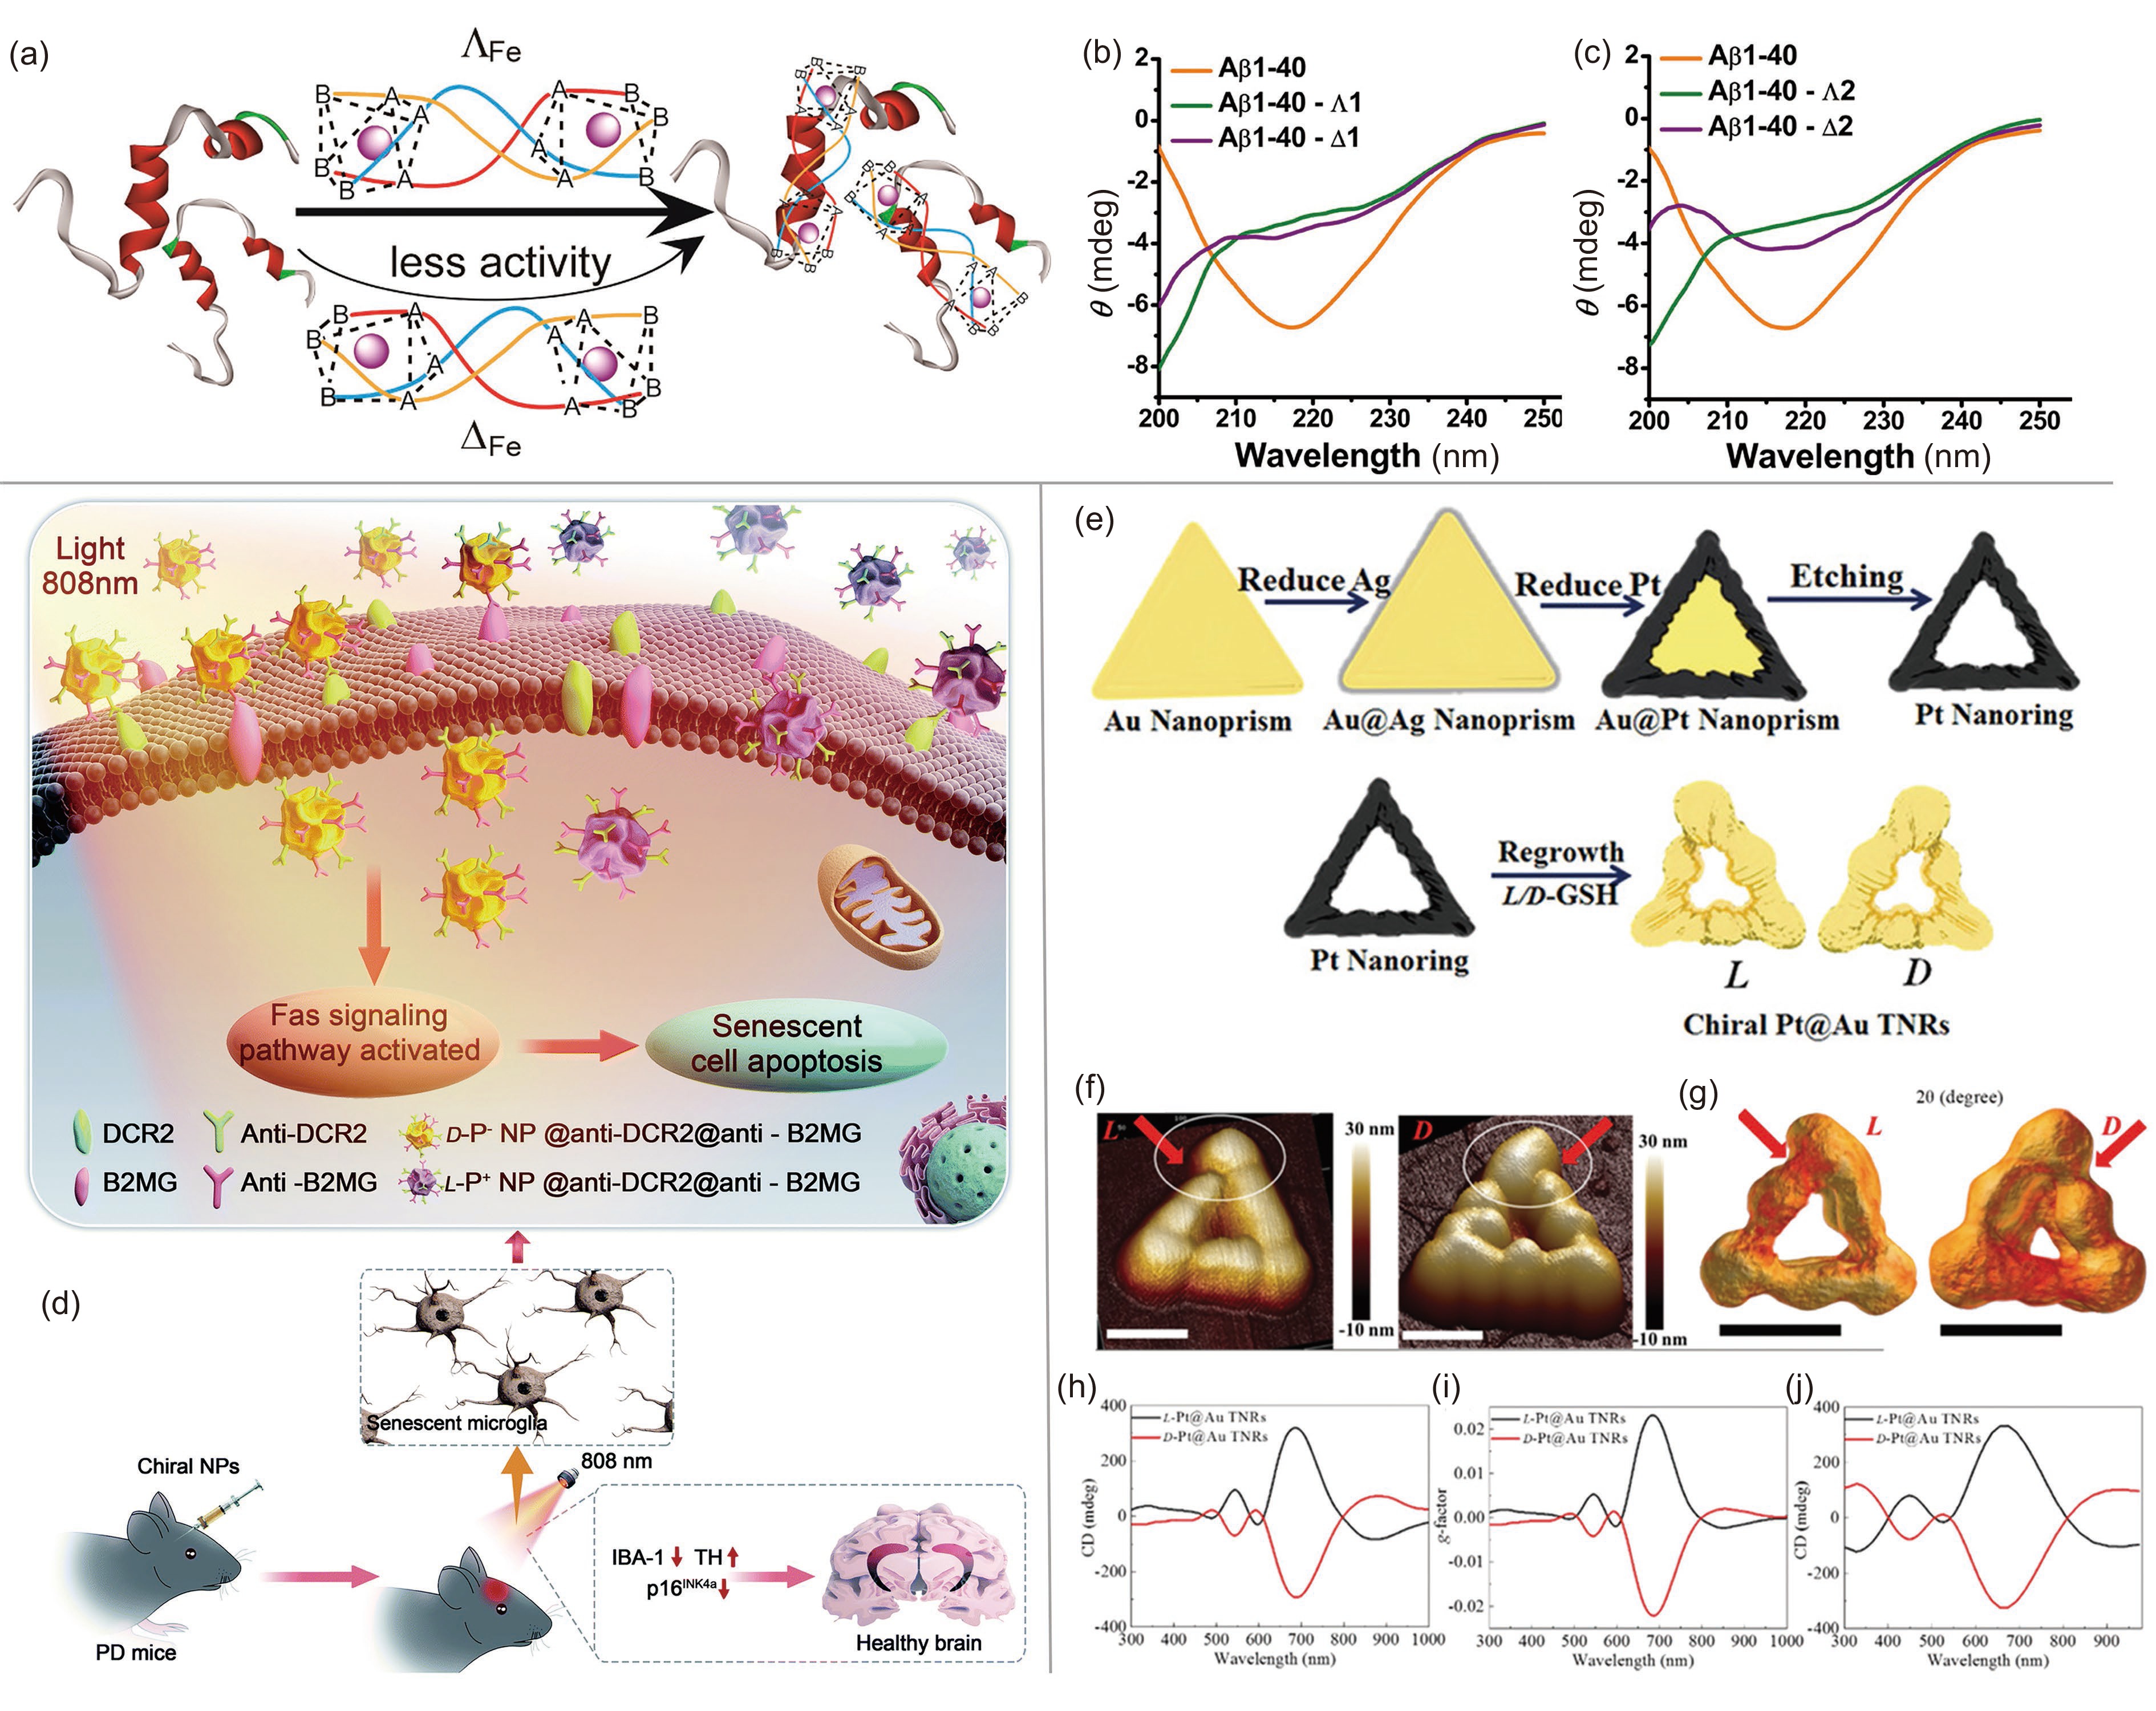
![]() (a) Representative illustration of enantioselective binding of Aβ by chiral metallosupramolecular complexes. CD spectra demonstrated the efficiency of (b) complex 1 and (c) complex 2 to inhibit Aβ1–40 aggregation. Adapted with permission from Ref. [55]. Copyright 2014, American Chemical Society. (d) Apoptosis pathways of senescent microglial cells in the brains of PD mice induced by chiral NPs. Adapted with permission from Ref. [32]. Copyright 2013, Royal Society of Chemistry. (e) Schematic illustration of the synthesis of chiral Pt@Au TNRs. (f) AFM and (g) 3D tomography images corresponding to L-Pt@Au TNR and D-Pt@Au TNR. (h) CD, (i) g-factor, and (j) simulated CD spectra of chiral Pt@Au TNRs. Adapted with permission from Ref. [22]. Copyright 2021, Wiley-VCH.
(a) Representative illustration of enantioselective binding of Aβ by chiral metallosupramolecular complexes. CD spectra demonstrated the efficiency of (b) complex 1 and (c) complex 2 to inhibit Aβ1–40 aggregation. Adapted with permission from Ref. [55]. Copyright 2014, American Chemical Society. (d) Apoptosis pathways of senescent microglial cells in the brains of PD mice induced by chiral NPs. Adapted with permission from Ref. [32]. Copyright 2013, Royal Society of Chemistry. (e) Schematic illustration of the synthesis of chiral Pt@Au TNRs. (f) AFM and (g) 3D tomography images corresponding to L-Pt@Au TNR and D-Pt@Au TNR. (h) CD, (i) g-factor, and (j) simulated CD spectra of chiral Pt@Au TNRs. Adapted with permission from Ref. [22]. Copyright 2021, Wiley-VCH.
-
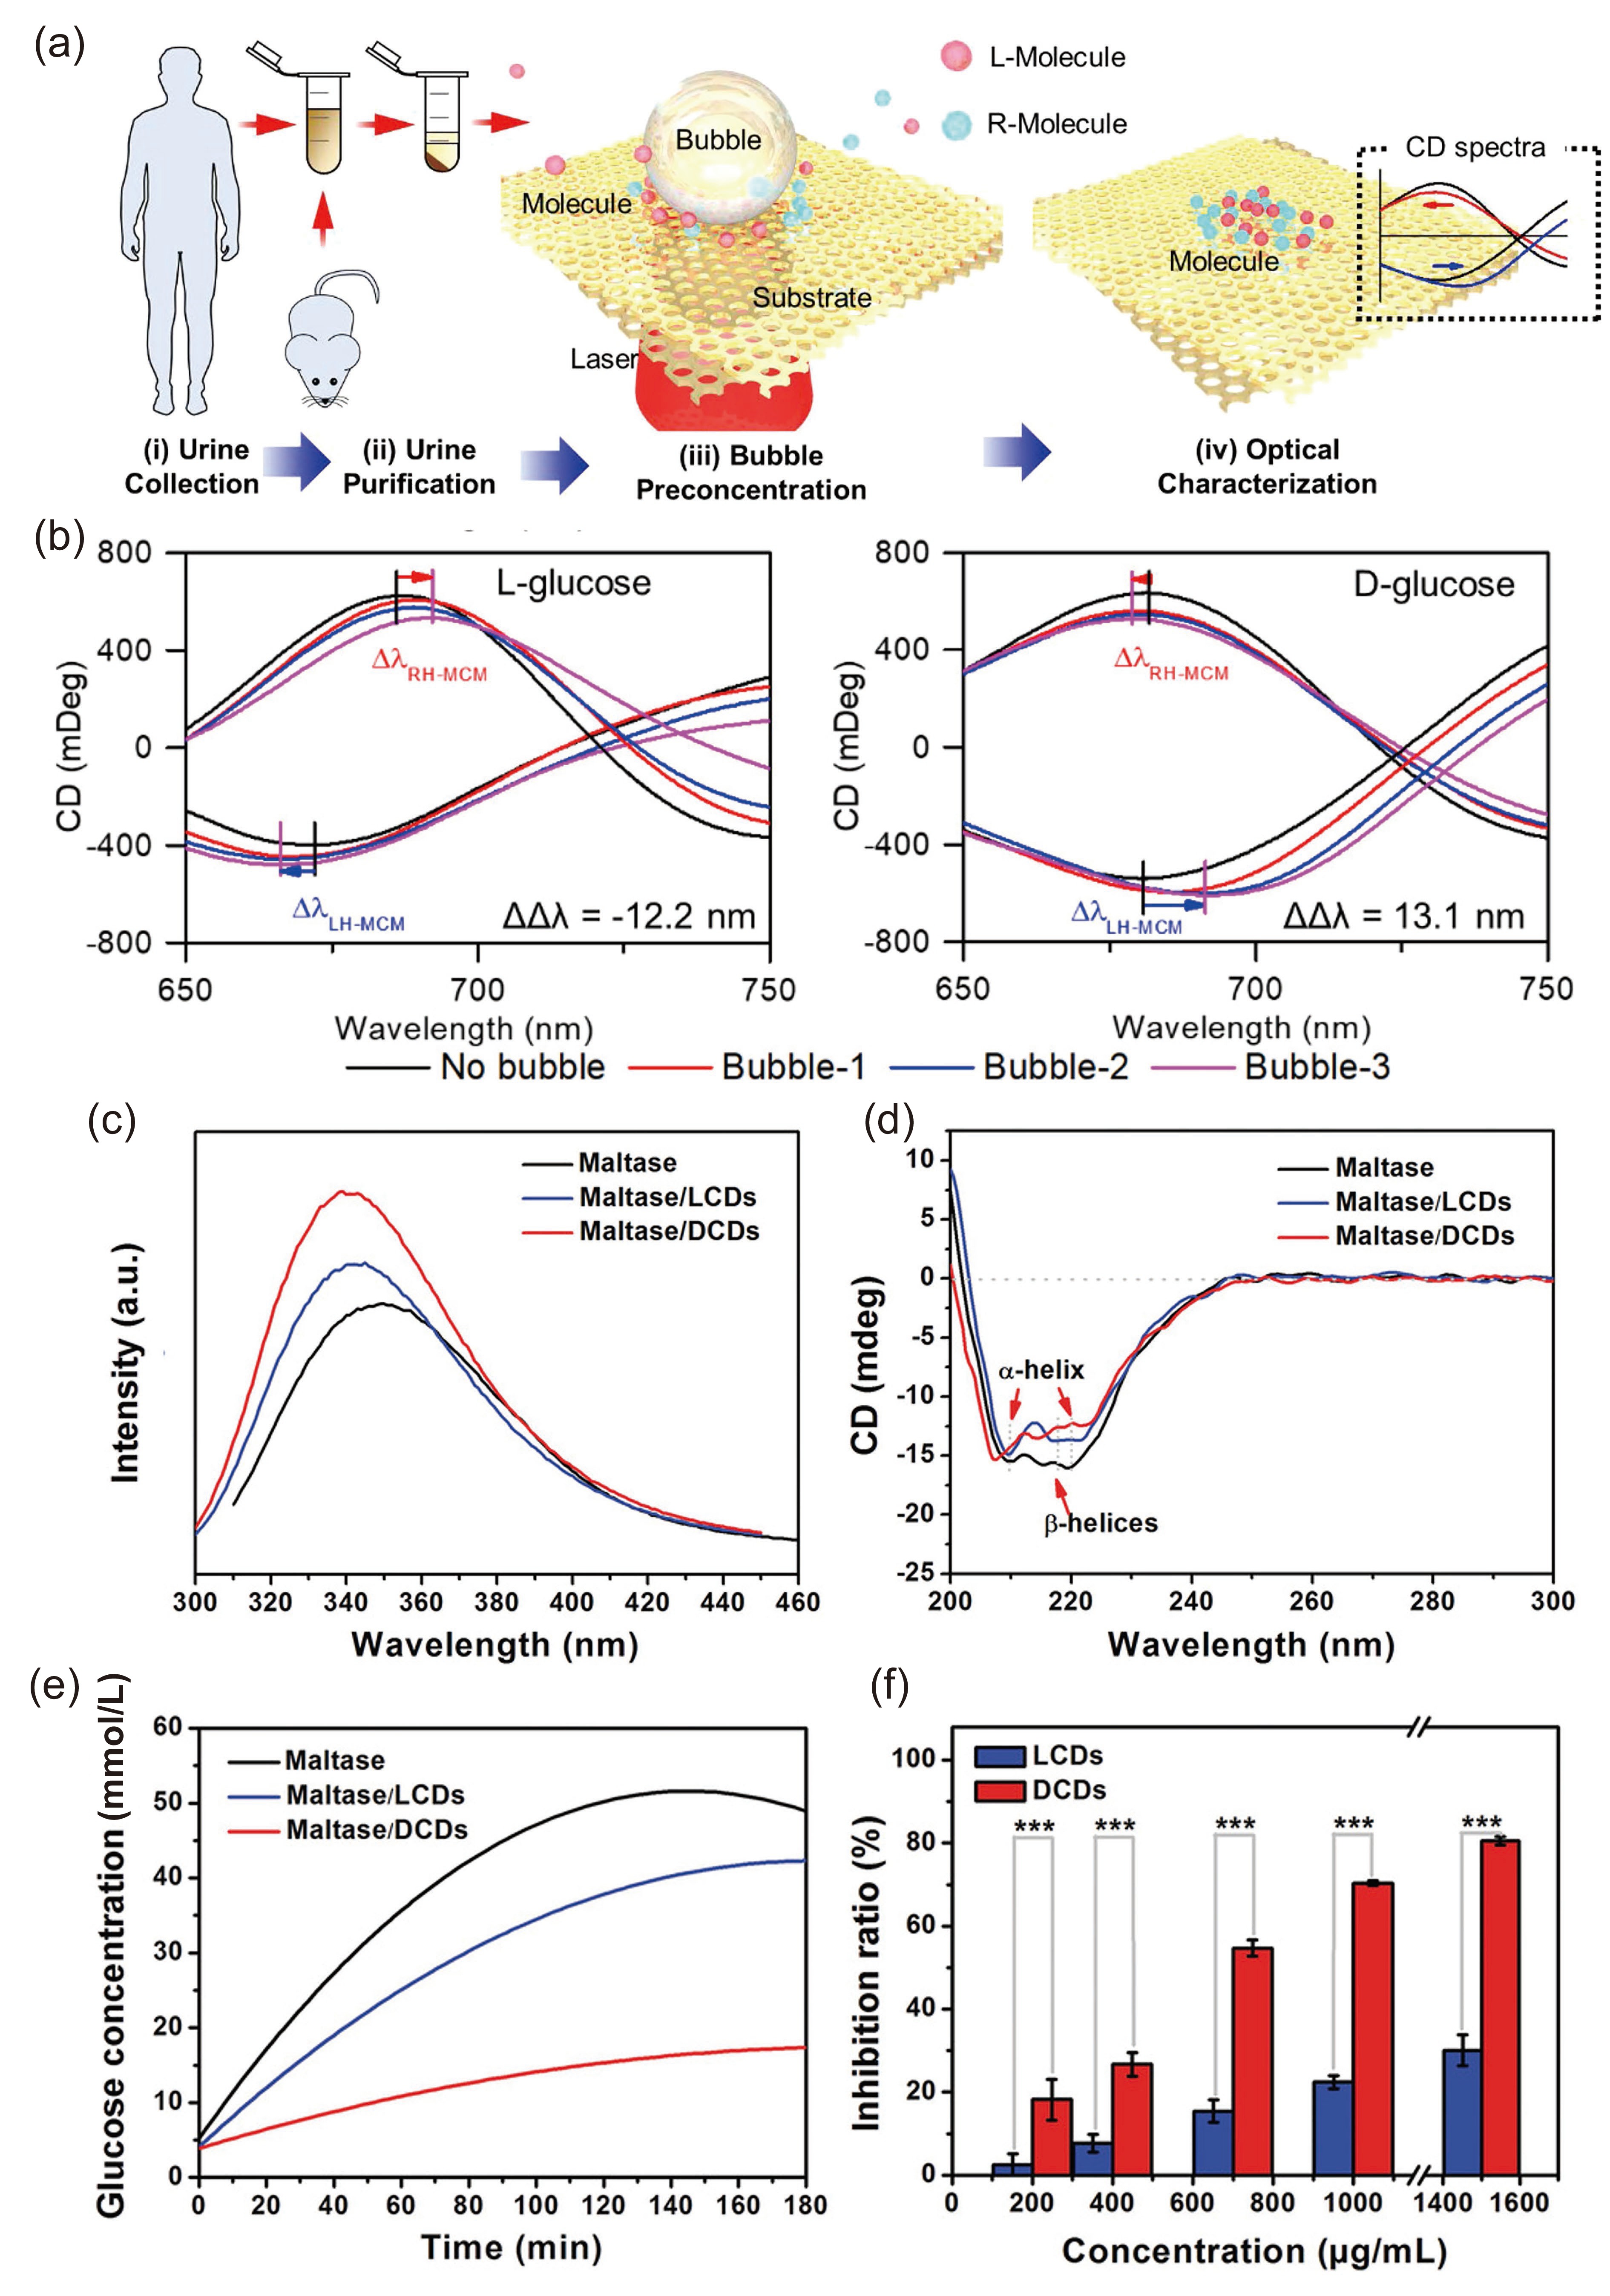
![]() (a) Illustration of the acquisition and purification of urine samples and the aggregation of chiral molecules in the urine on MCMs for more sensitive detection by the shift of CD spectra. (b) CD spectra of LH-MCMs and RH-MCMs under interaction with L- and D-glucose during continuous microbubble-assisted accumulation. Adapted with permission from Ref. [65]. Copyright 2021, American Chemical Society. (c) PL spectra (λex = 280 nm) and (d) CD spectra of maltase (black line), maltase/LCDs (blue line), and maltase/DCDs (red line) with maltase and CD concentrations of 2.5 and 1.5 mg/mL, respectively. (e) Illustration of the effect of different hydrolysis times of maltase (black line), maltase/LCDs (blue line), and maltase/DCDs (red line) on the glucose concentration. (f) Illustration of the effect of LCDs and DCDs at different concentrations on the inhibition of maltase. Adapted with permission from Ref. [66]. Copyright 2019, Wiley-VCH.
(a) Illustration of the acquisition and purification of urine samples and the aggregation of chiral molecules in the urine on MCMs for more sensitive detection by the shift of CD spectra. (b) CD spectra of LH-MCMs and RH-MCMs under interaction with L- and D-glucose during continuous microbubble-assisted accumulation. Adapted with permission from Ref. [65]. Copyright 2021, American Chemical Society. (c) PL spectra (λex = 280 nm) and (d) CD spectra of maltase (black line), maltase/LCDs (blue line), and maltase/DCDs (red line) with maltase and CD concentrations of 2.5 and 1.5 mg/mL, respectively. (e) Illustration of the effect of different hydrolysis times of maltase (black line), maltase/LCDs (blue line), and maltase/DCDs (red line) on the glucose concentration. (f) Illustration of the effect of LCDs and DCDs at different concentrations on the inhibition of maltase. Adapted with permission from Ref. [66]. Copyright 2019, Wiley-VCH.
-
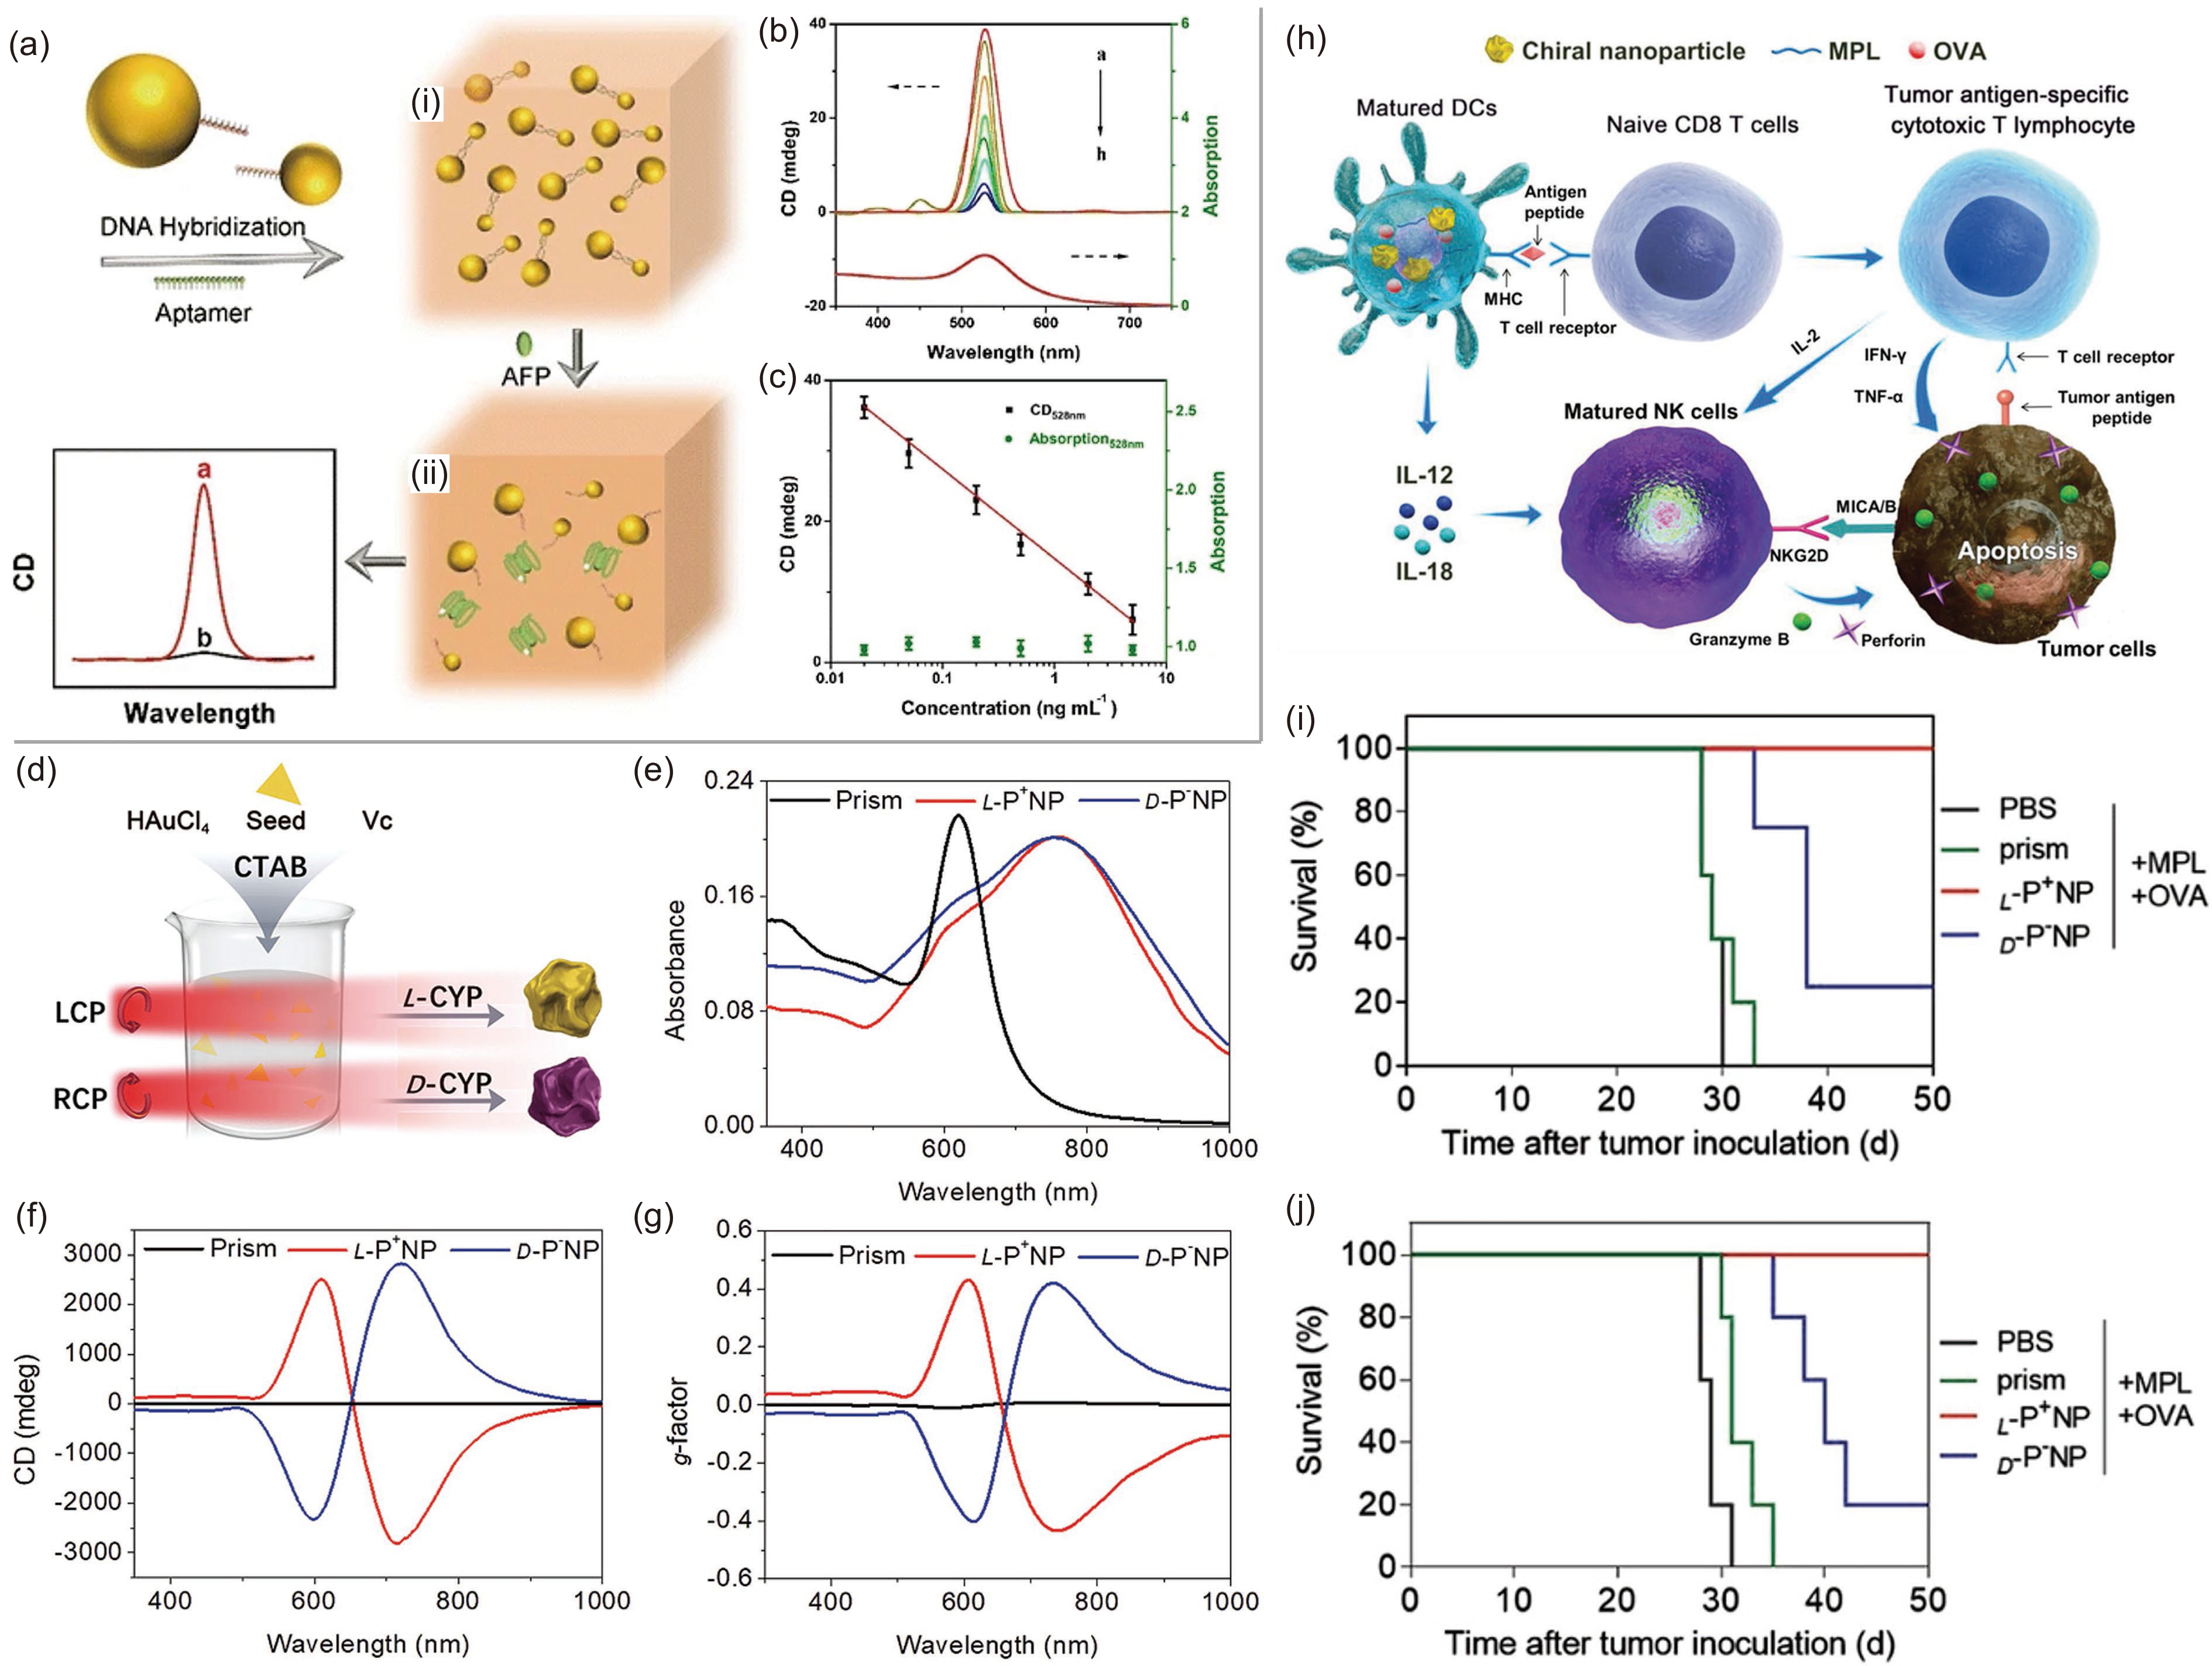
![]() (a) Illustration of the detection mechanism of chiral Au NPs for AFP. (b) CD and UV‒vis spectra of chiral Au with different concentrations of AFP. (c) Illustration of the logarithmic relationship between CD spectra and the concentration of AFP. Adapted with permission from Ref. [68]. Copyright 2017, Springer Nature. (d) The fabrication process of chiral Au NPs. (e) UV–vis, (f) CD and (g) g-factor spectra of prism and chiral NPs under irradiation at 594 nm with 84 mW· cm−2 for 30 min. (h) The mechanism of action of chiral NPs for tumor therapy. (i) The survival of mice with tumor cells under the influence of PBS, prism, L-NPs and D-NPs. (j) The preventative effects. Adapted with permission from Ref. [34]. Copyright 2022, Wiley-VCH.
(a) Illustration of the detection mechanism of chiral Au NPs for AFP. (b) CD and UV‒vis spectra of chiral Au with different concentrations of AFP. (c) Illustration of the logarithmic relationship between CD spectra and the concentration of AFP. Adapted with permission from Ref. [68]. Copyright 2017, Springer Nature. (d) The fabrication process of chiral Au NPs. (e) UV–vis, (f) CD and (g) g-factor spectra of prism and chiral NPs under irradiation at 594 nm with 84 mW· cm−2 for 30 min. (h) The mechanism of action of chiral NPs for tumor therapy. (i) The survival of mice with tumor cells under the influence of PBS, prism, L-NPs and D-NPs. (j) The preventative effects. Adapted with permission from Ref. [34]. Copyright 2022, Wiley-VCH.