 Download:
Figures of the Article
-
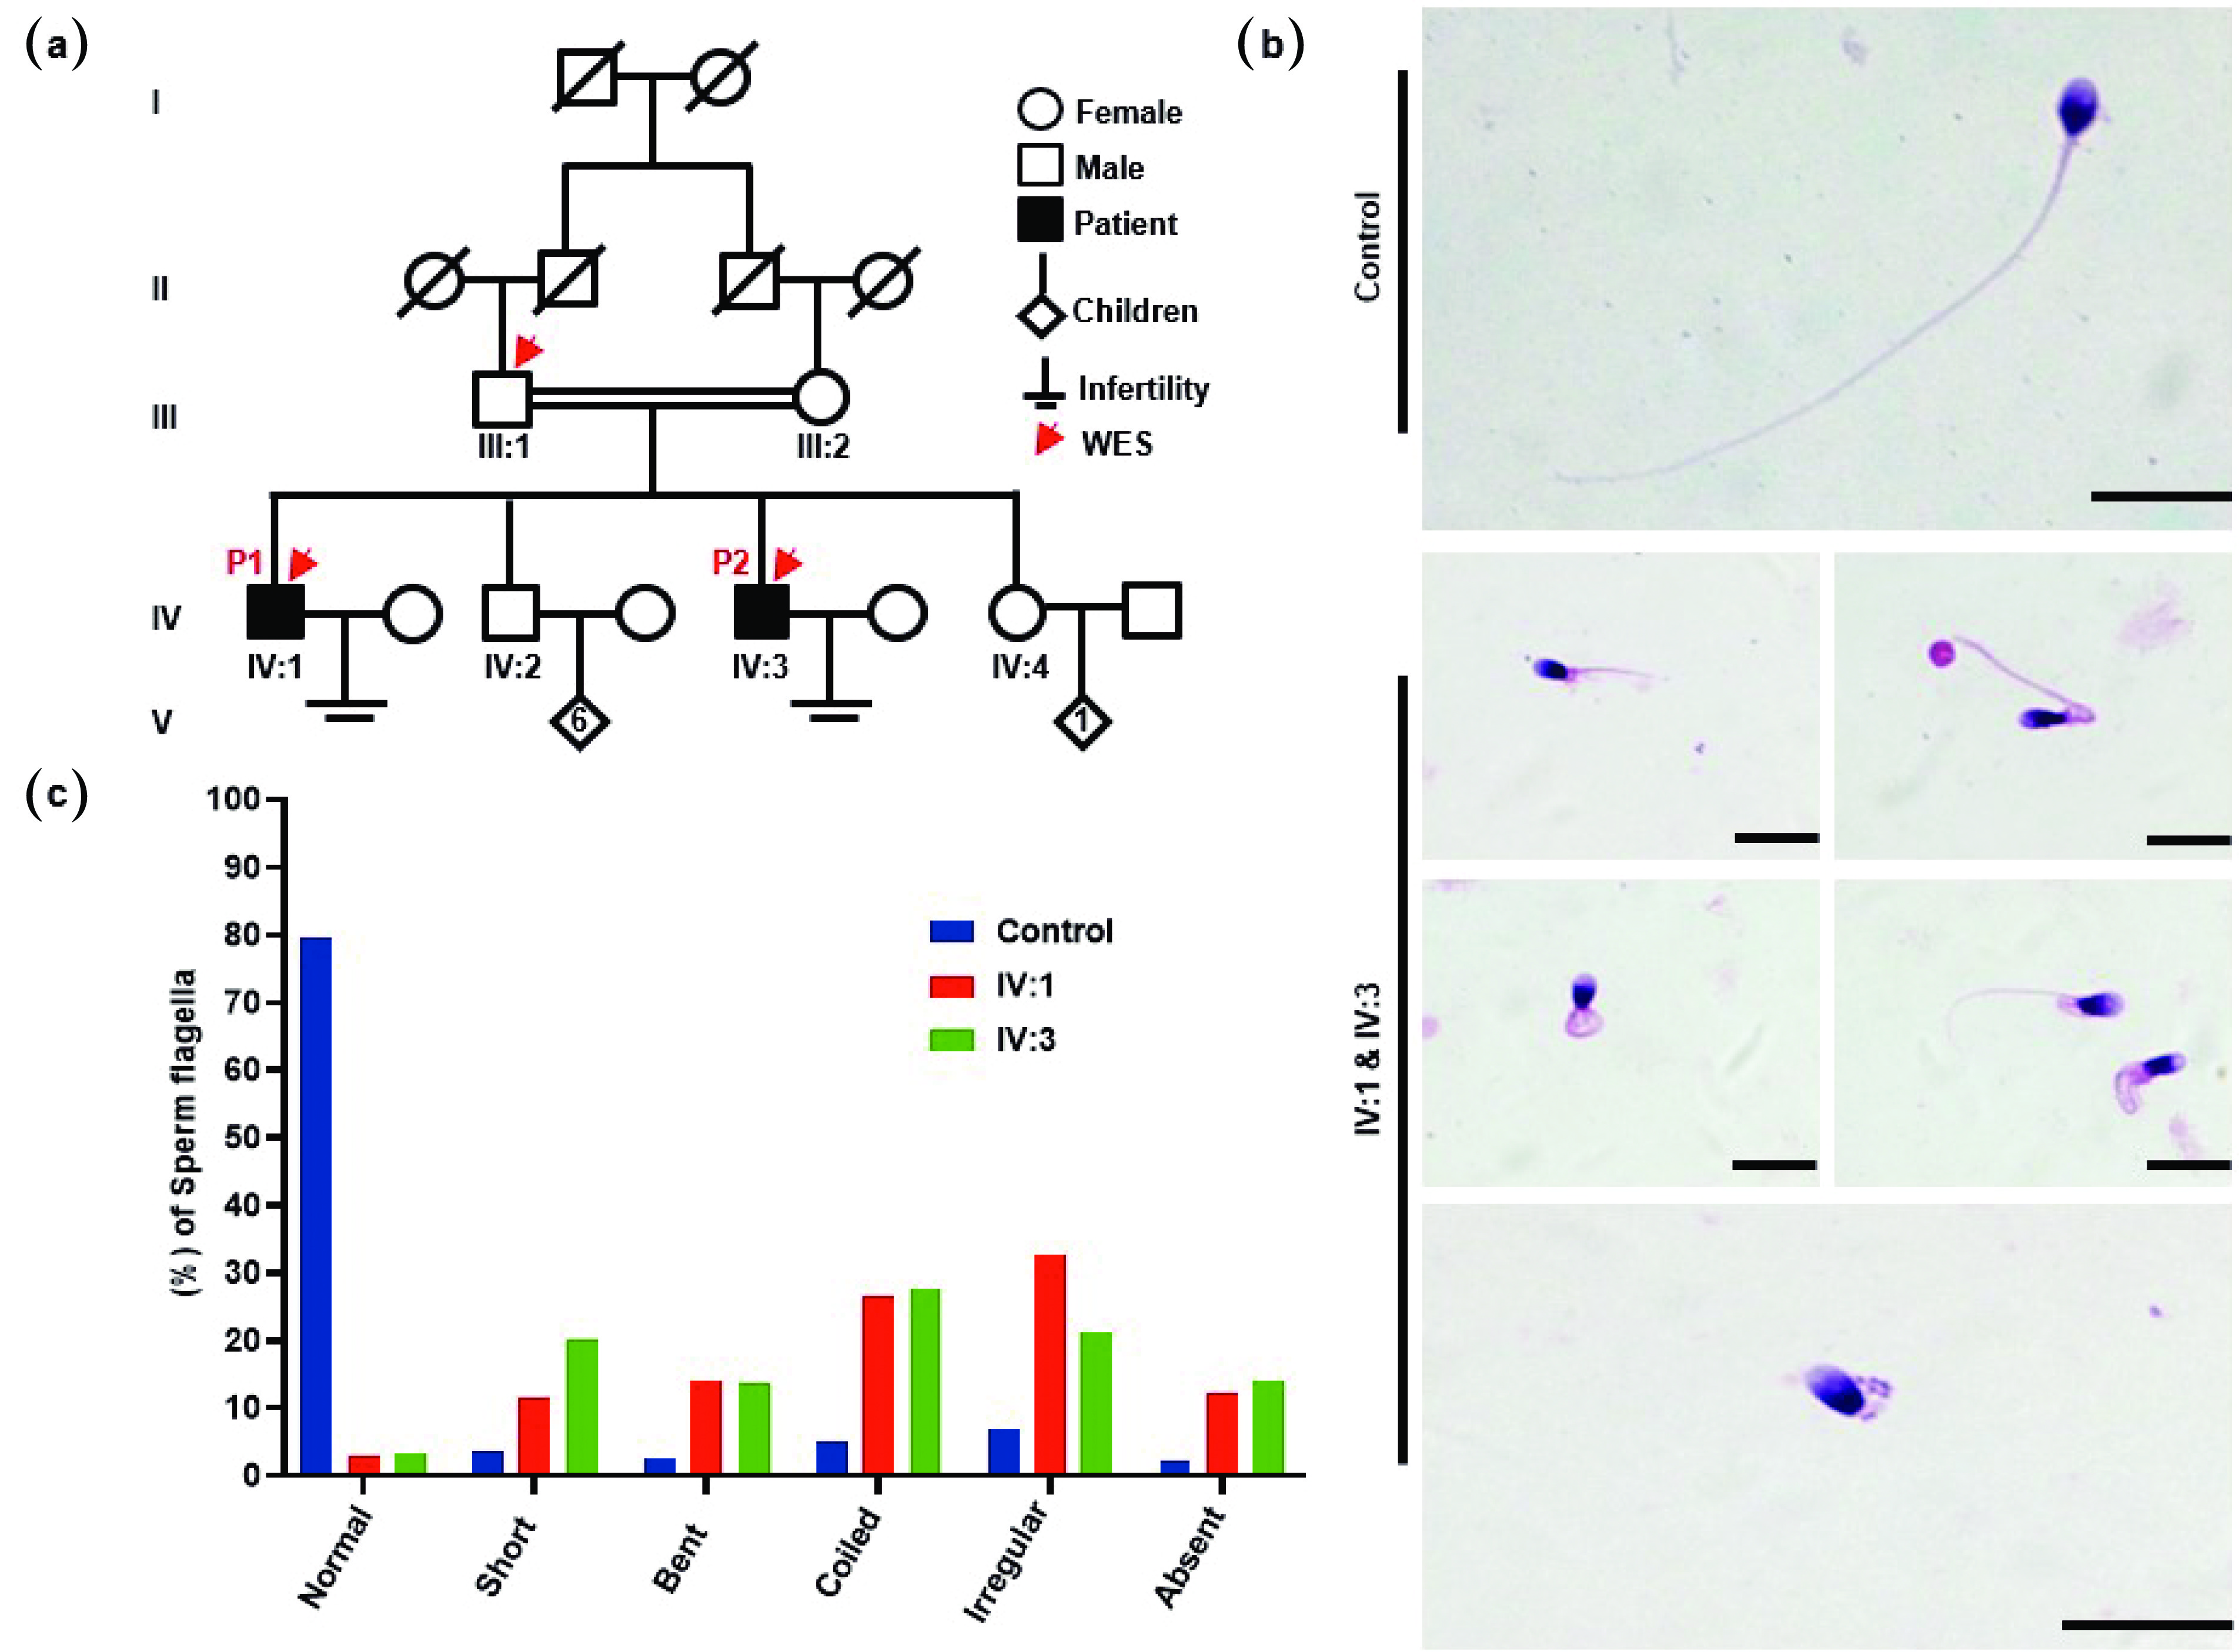
![]() MMAF patients from a Pakistani consanguineous family. (a) Pedigree chart of two infertile male patients, IV:1 and IV:3, from a consanguineous marriage. Squares denote males, while circles represent females. The solid squares denote the patients, and the hollow squares represent the unaffected individuals. The double horizontal lines indicate a consanguineous marriage. The Arabic numerals indicate the number of children born to a couple, whereas the Roman numerals indicate the generation number. The red arrows on the pedigree chart represent individuals analyzed via WES. (b) H&E staining showing the morphological defects of flagella in the spermatozoa of MMAF patients, including (i) short, (ii) bent, (iii) coiled, (iv) irregular caliber, and (v) absent. (c) Statistics of flagellar abnormalities in both the fertile controls and the patients (IV:1 & IV:3). Scale bars = 10 µm. WES: whole-exome sequencing.
MMAF patients from a Pakistani consanguineous family. (a) Pedigree chart of two infertile male patients, IV:1 and IV:3, from a consanguineous marriage. Squares denote males, while circles represent females. The solid squares denote the patients, and the hollow squares represent the unaffected individuals. The double horizontal lines indicate a consanguineous marriage. The Arabic numerals indicate the number of children born to a couple, whereas the Roman numerals indicate the generation number. The red arrows on the pedigree chart represent individuals analyzed via WES. (b) H&E staining showing the morphological defects of flagella in the spermatozoa of MMAF patients, including (i) short, (ii) bent, (iii) coiled, (iv) irregular caliber, and (v) absent. (c) Statistics of flagellar abnormalities in both the fertile controls and the patients (IV:1 & IV:3). Scale bars = 10 µm. WES: whole-exome sequencing.
-
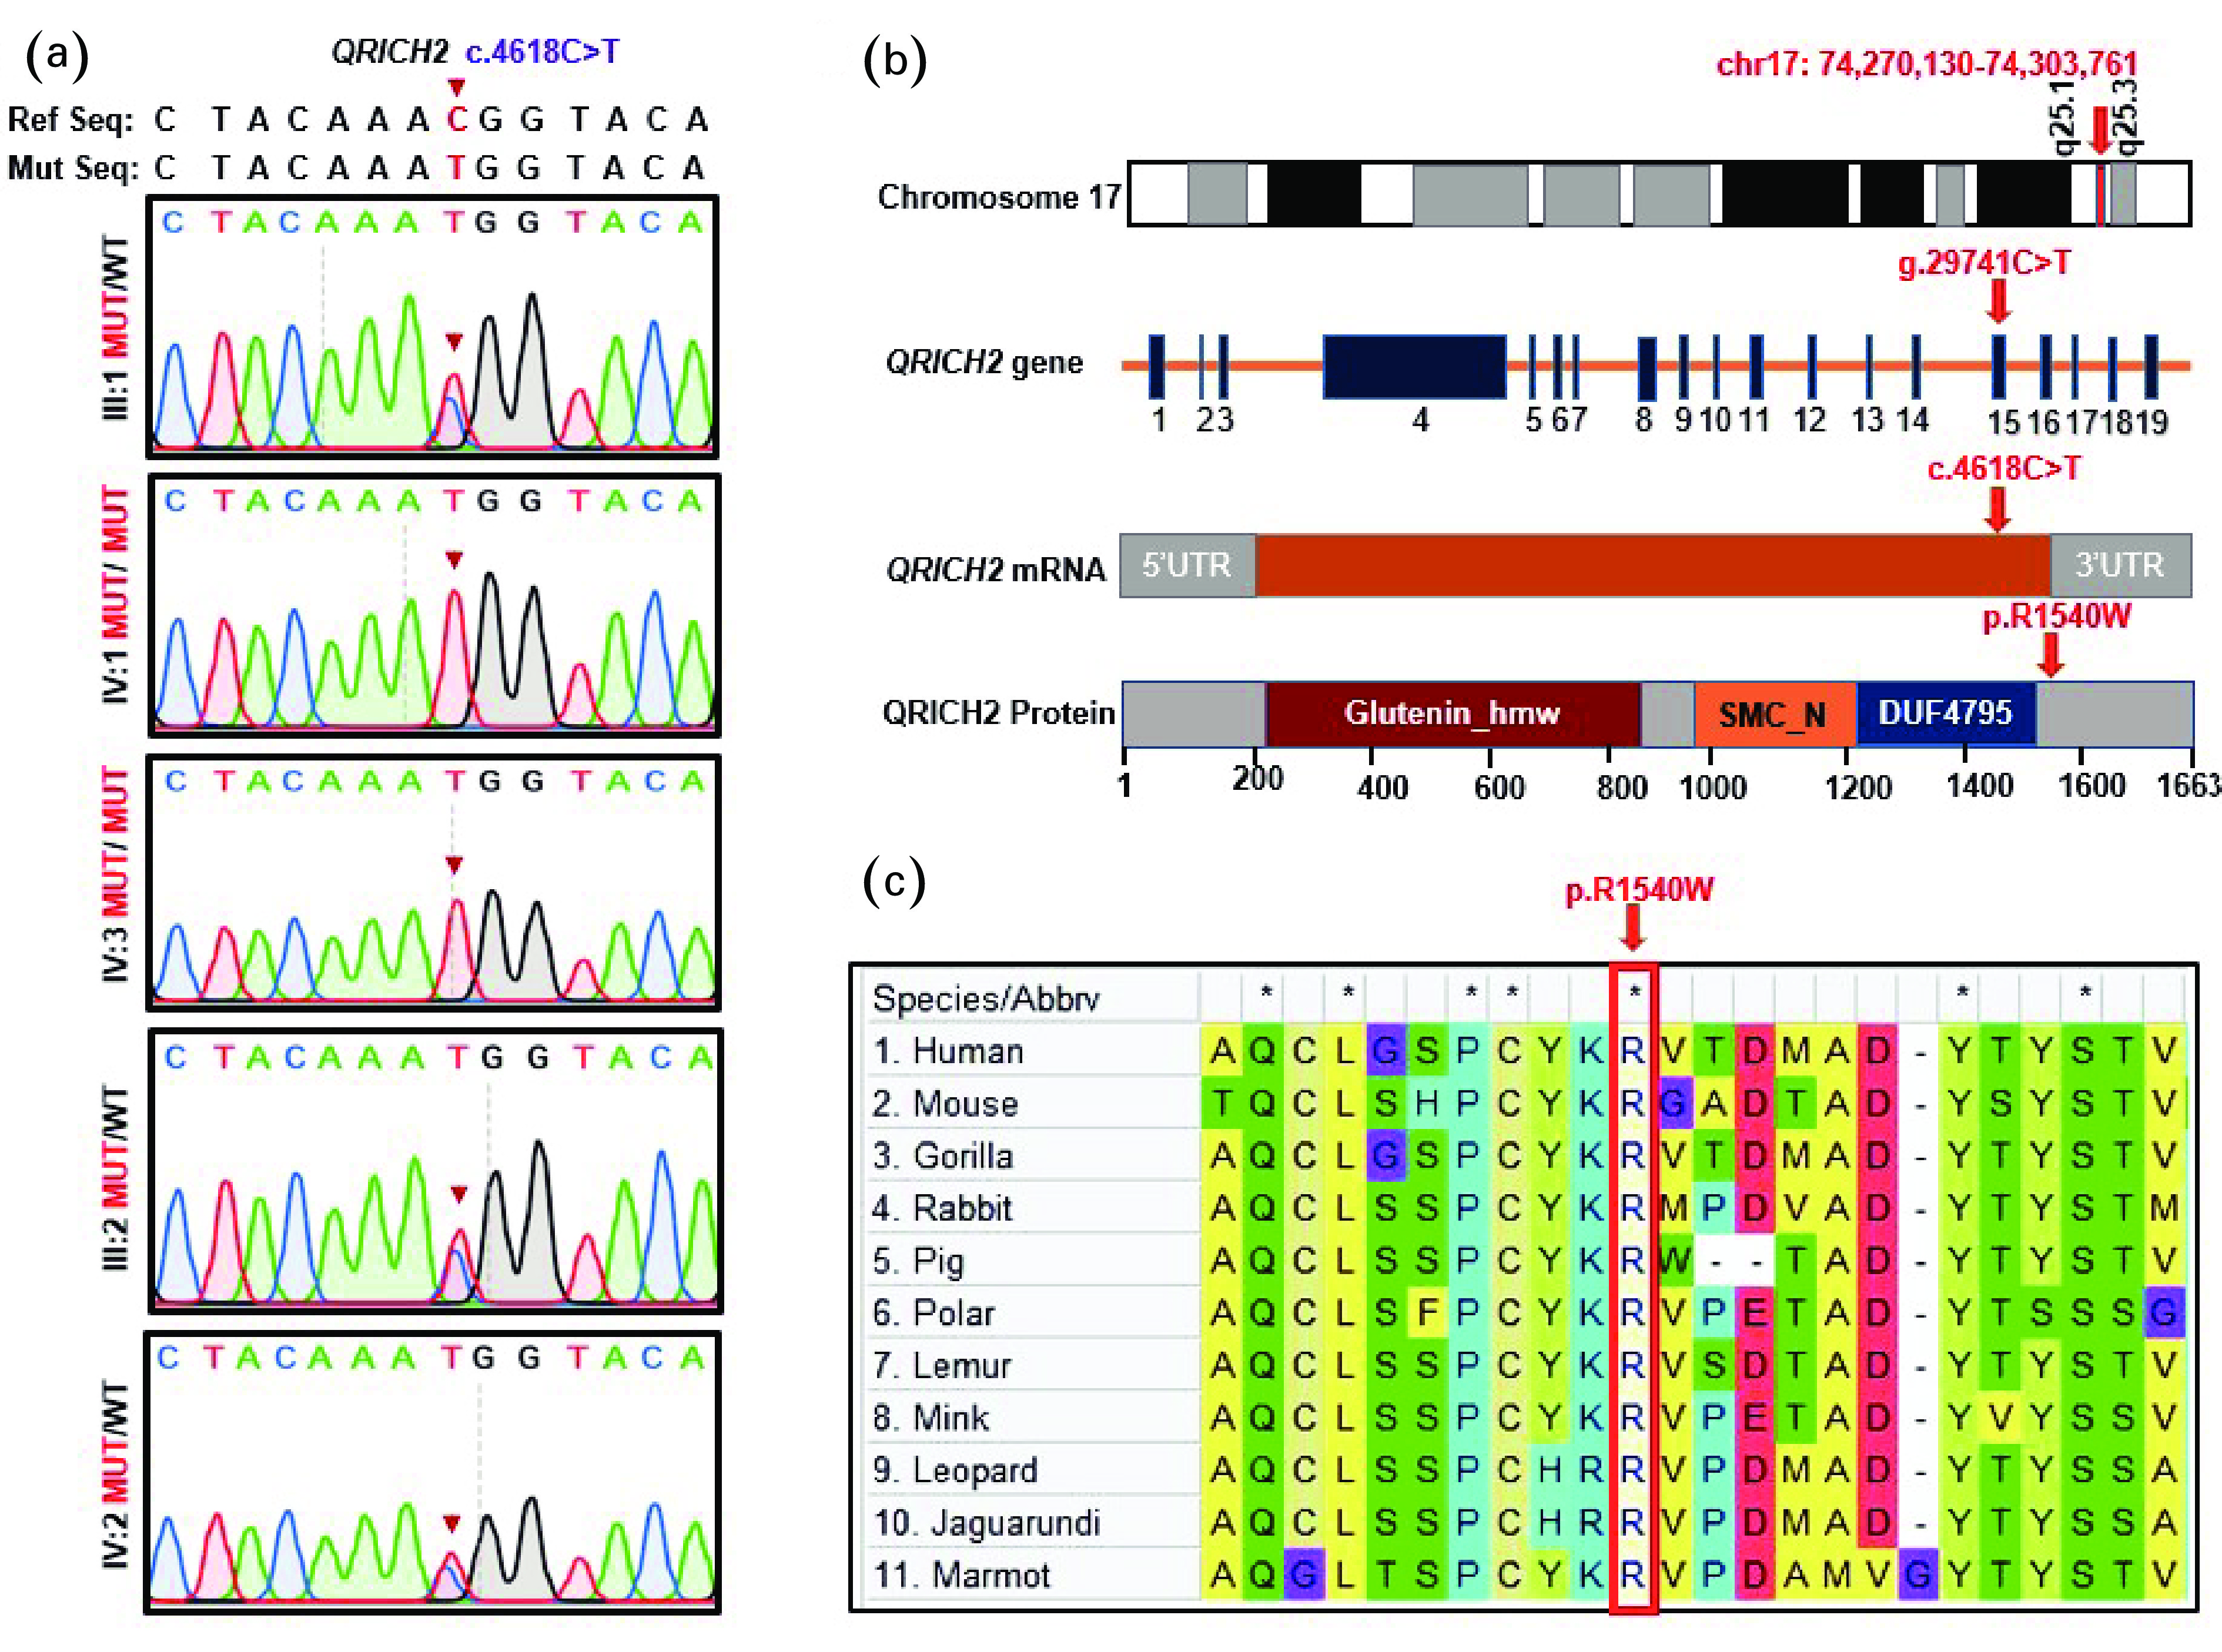
![]() Identification of a novel homozygous QRICH2 missense variant. (a) Sanger sequencing verification of the QRICH2 mutation, c.4618C>T, across available family members. The parents (III:1 & III:2) and the fertile brother (IV:2) were heterozygous, whereas the patients (IV:1 & IV:3) were homozygous for the identified mutation. Red arrows indicate the identified mutation. (b) QRICH2 structure and position of the identified mutation at the genomic, transcriptional, and protein levels. QRICH2 is located at chromosome 17 and consists of 19 exons encoding a protein of
Identification of a novel homozygous QRICH2 missense variant. (a) Sanger sequencing verification of the QRICH2 mutation, c.4618C>T, across available family members. The parents (III:1 & III:2) and the fertile brother (IV:2) were heterozygous, whereas the patients (IV:1 & IV:3) were homozygous for the identified mutation. Red arrows indicate the identified mutation. (b) QRICH2 structure and position of the identified mutation at the genomic, transcriptional, and protein levels. QRICH2 is located at chromosome 17 and consists of 19 exons encoding a protein of 1663 amino acids (NM_032134.2). The identified mutation is located in exon 15. Red arrows denote the mutation site at the gDNA, CDS, and protein levels. (c) Conservation of the affected amino acid (arginine) across different species is evident in the multiple sequence alignment. MUT: mutant allele; WT: wild-type allele; T: thymine; G: guanine; C: cytosine; A: adenine; QRICH2: glutamine-rich protein 2; UTR: untranslated region. -
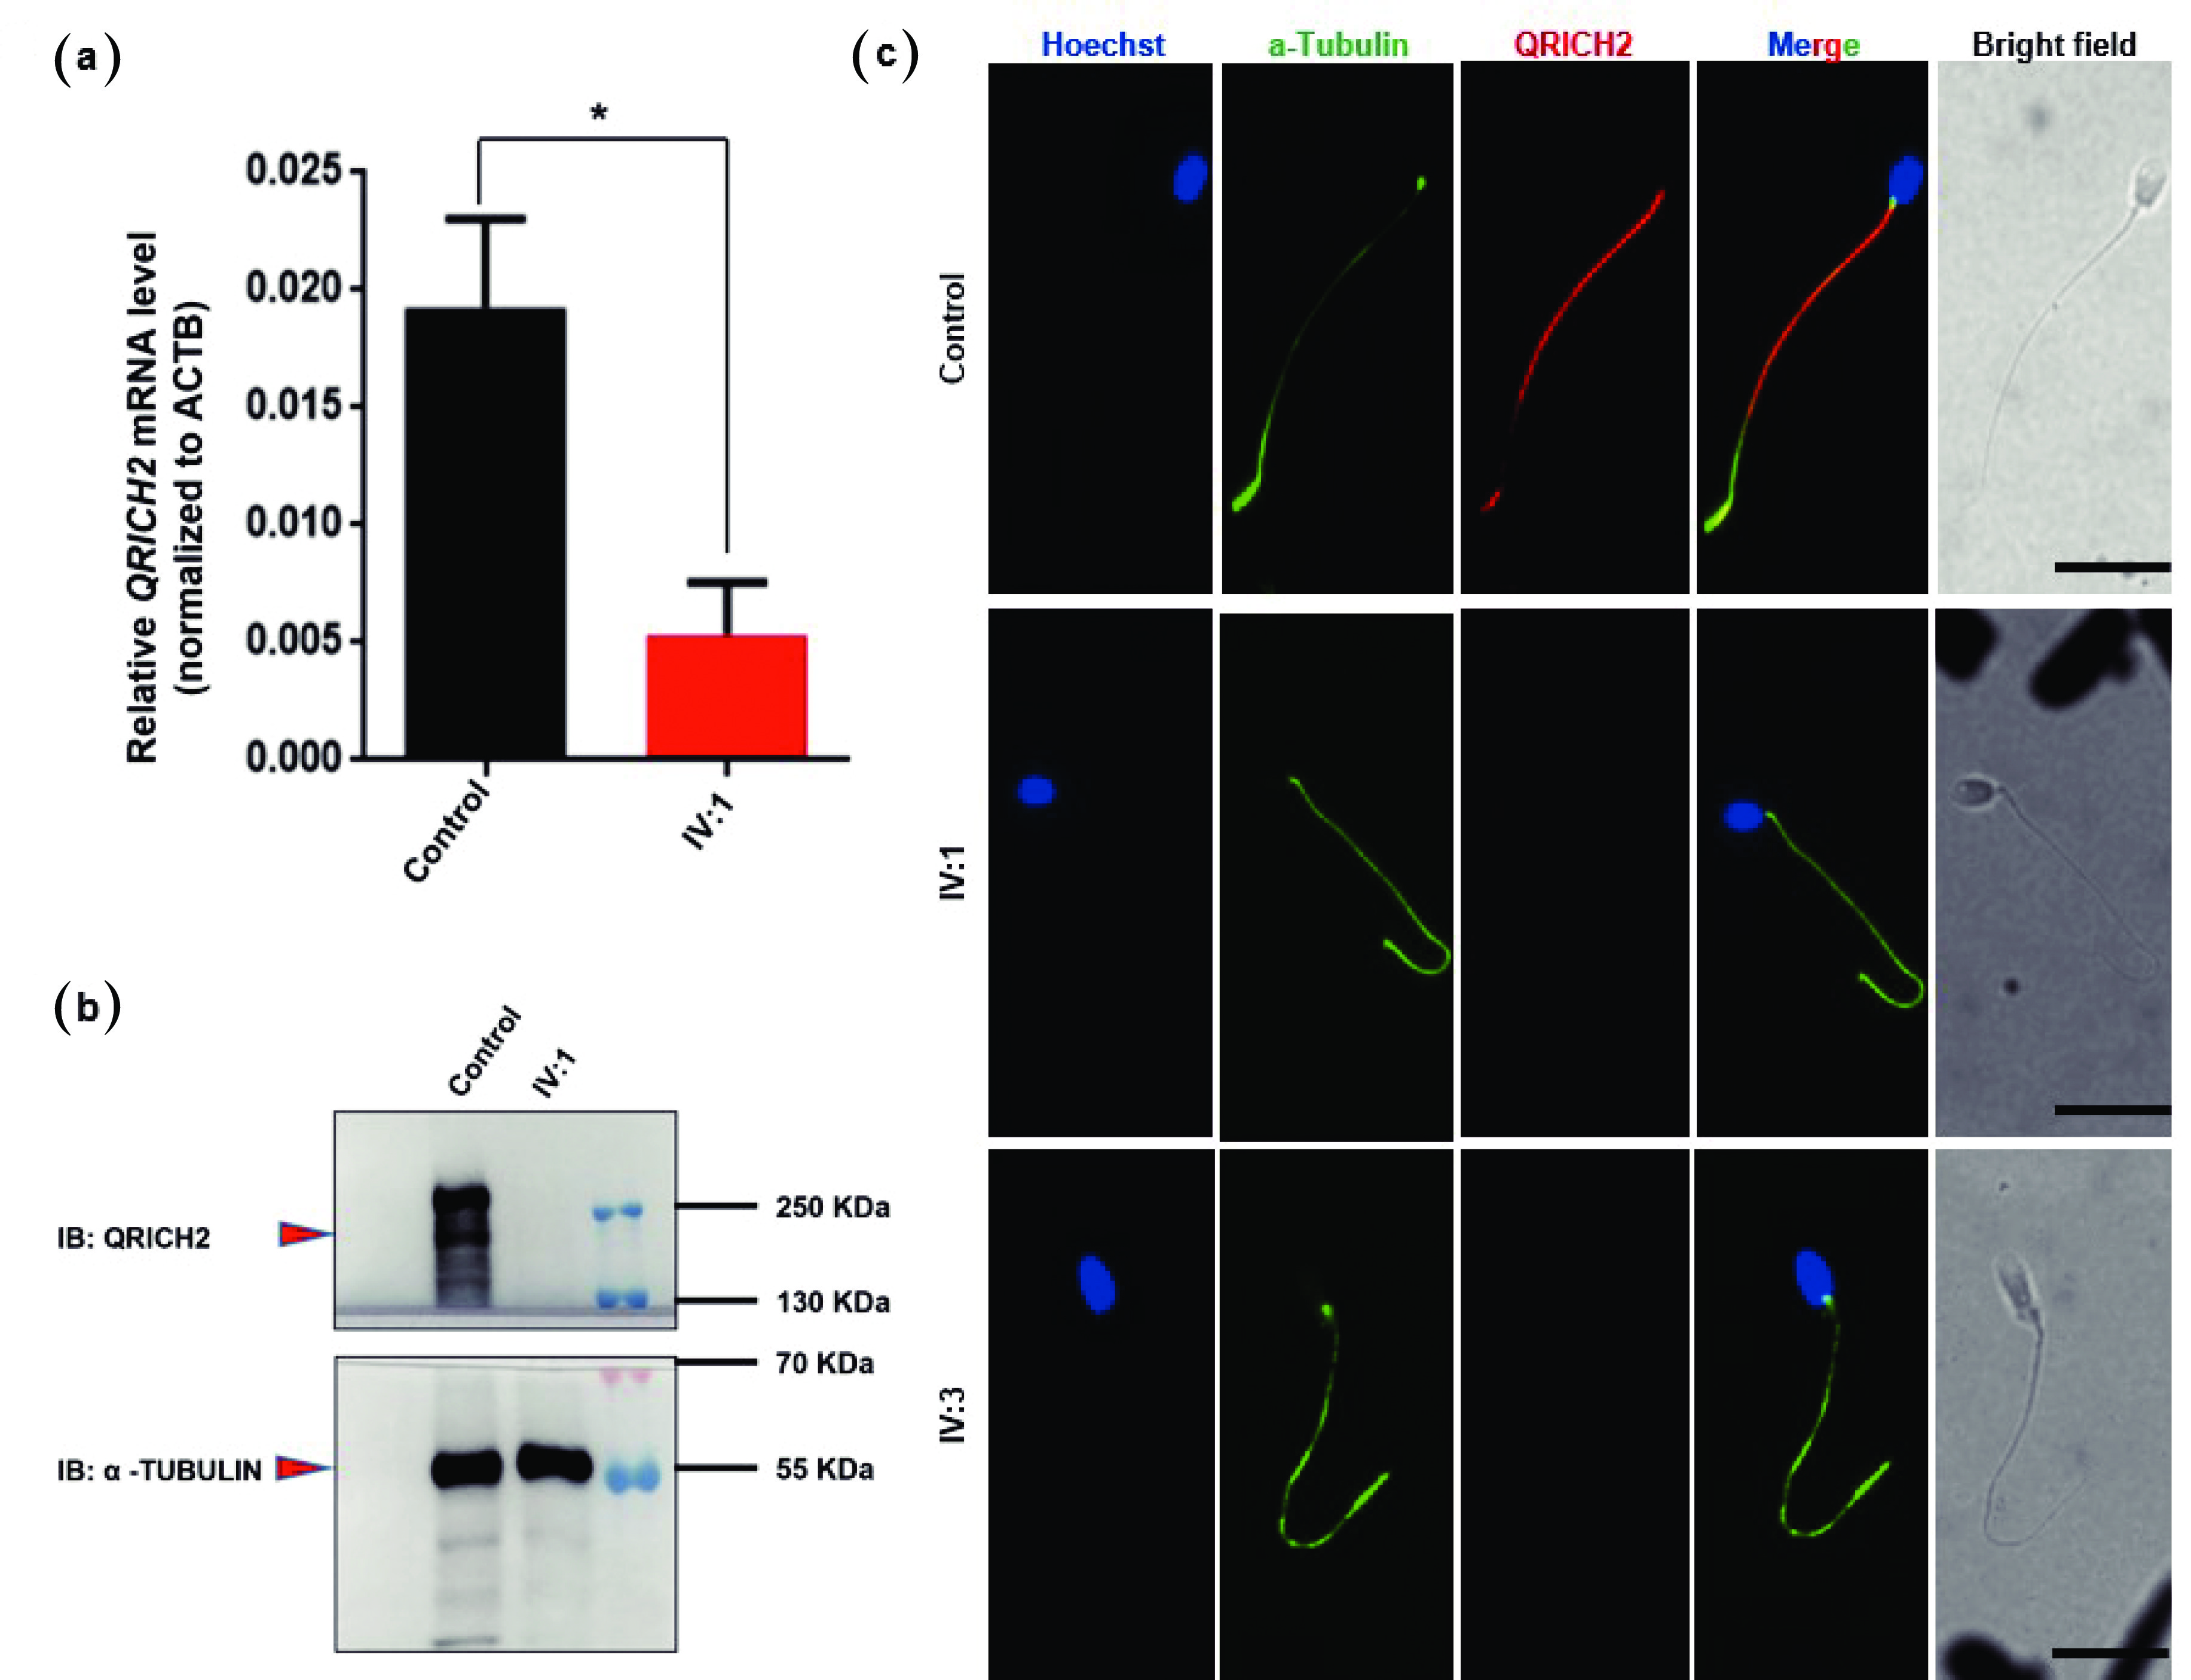
![]() QRICH2 expression was absent in the patient’s spermatozoa. (a) The graph represents the QRICH2 mRNA expression level of patient IV:1 with a low level of QRICH2 compared with that of the fertile control. n = 3, Student’s t test; *P < 0.05. (b) Representative western blot images showing the presence of the QRICH2 band in the sperm lysate of the normal fertile control and the complete absence of the band in patient IV:1. A loading control (e.g., α-tubulin) was used to ensure equal protein loading. (c) Representative images of spermatozoa from normal fertile controls and patients (IV:1 & IV:3) costained with an anti-QRICH2 antibody (red), an anti-α-tubulin antibody (green), and Hoechst (blue, nuclear marker). The QRICH2 signals were absent in the spermatozoa of the patients (IV:1 & IV:3), whereas normal signals of QRICH2 were observed in the anterior sperm flagella of the normal fertile controls. Scale bars = 10 µm. QRICH2: Glutamine-rich protein 2. Statistical analysis revealed that the difference in QRICH2 expression between patients (IV:1) and normal fertile controls was significant (*P<0.05).
QRICH2 expression was absent in the patient’s spermatozoa. (a) The graph represents the QRICH2 mRNA expression level of patient IV:1 with a low level of QRICH2 compared with that of the fertile control. n = 3, Student’s t test; *P < 0.05. (b) Representative western blot images showing the presence of the QRICH2 band in the sperm lysate of the normal fertile control and the complete absence of the band in patient IV:1. A loading control (e.g., α-tubulin) was used to ensure equal protein loading. (c) Representative images of spermatozoa from normal fertile controls and patients (IV:1 & IV:3) costained with an anti-QRICH2 antibody (red), an anti-α-tubulin antibody (green), and Hoechst (blue, nuclear marker). The QRICH2 signals were absent in the spermatozoa of the patients (IV:1 & IV:3), whereas normal signals of QRICH2 were observed in the anterior sperm flagella of the normal fertile controls. Scale bars = 10 µm. QRICH2: Glutamine-rich protein 2. Statistical analysis revealed that the difference in QRICH2 expression between patients (IV:1) and normal fertile controls was significant (*P<0.05).
-
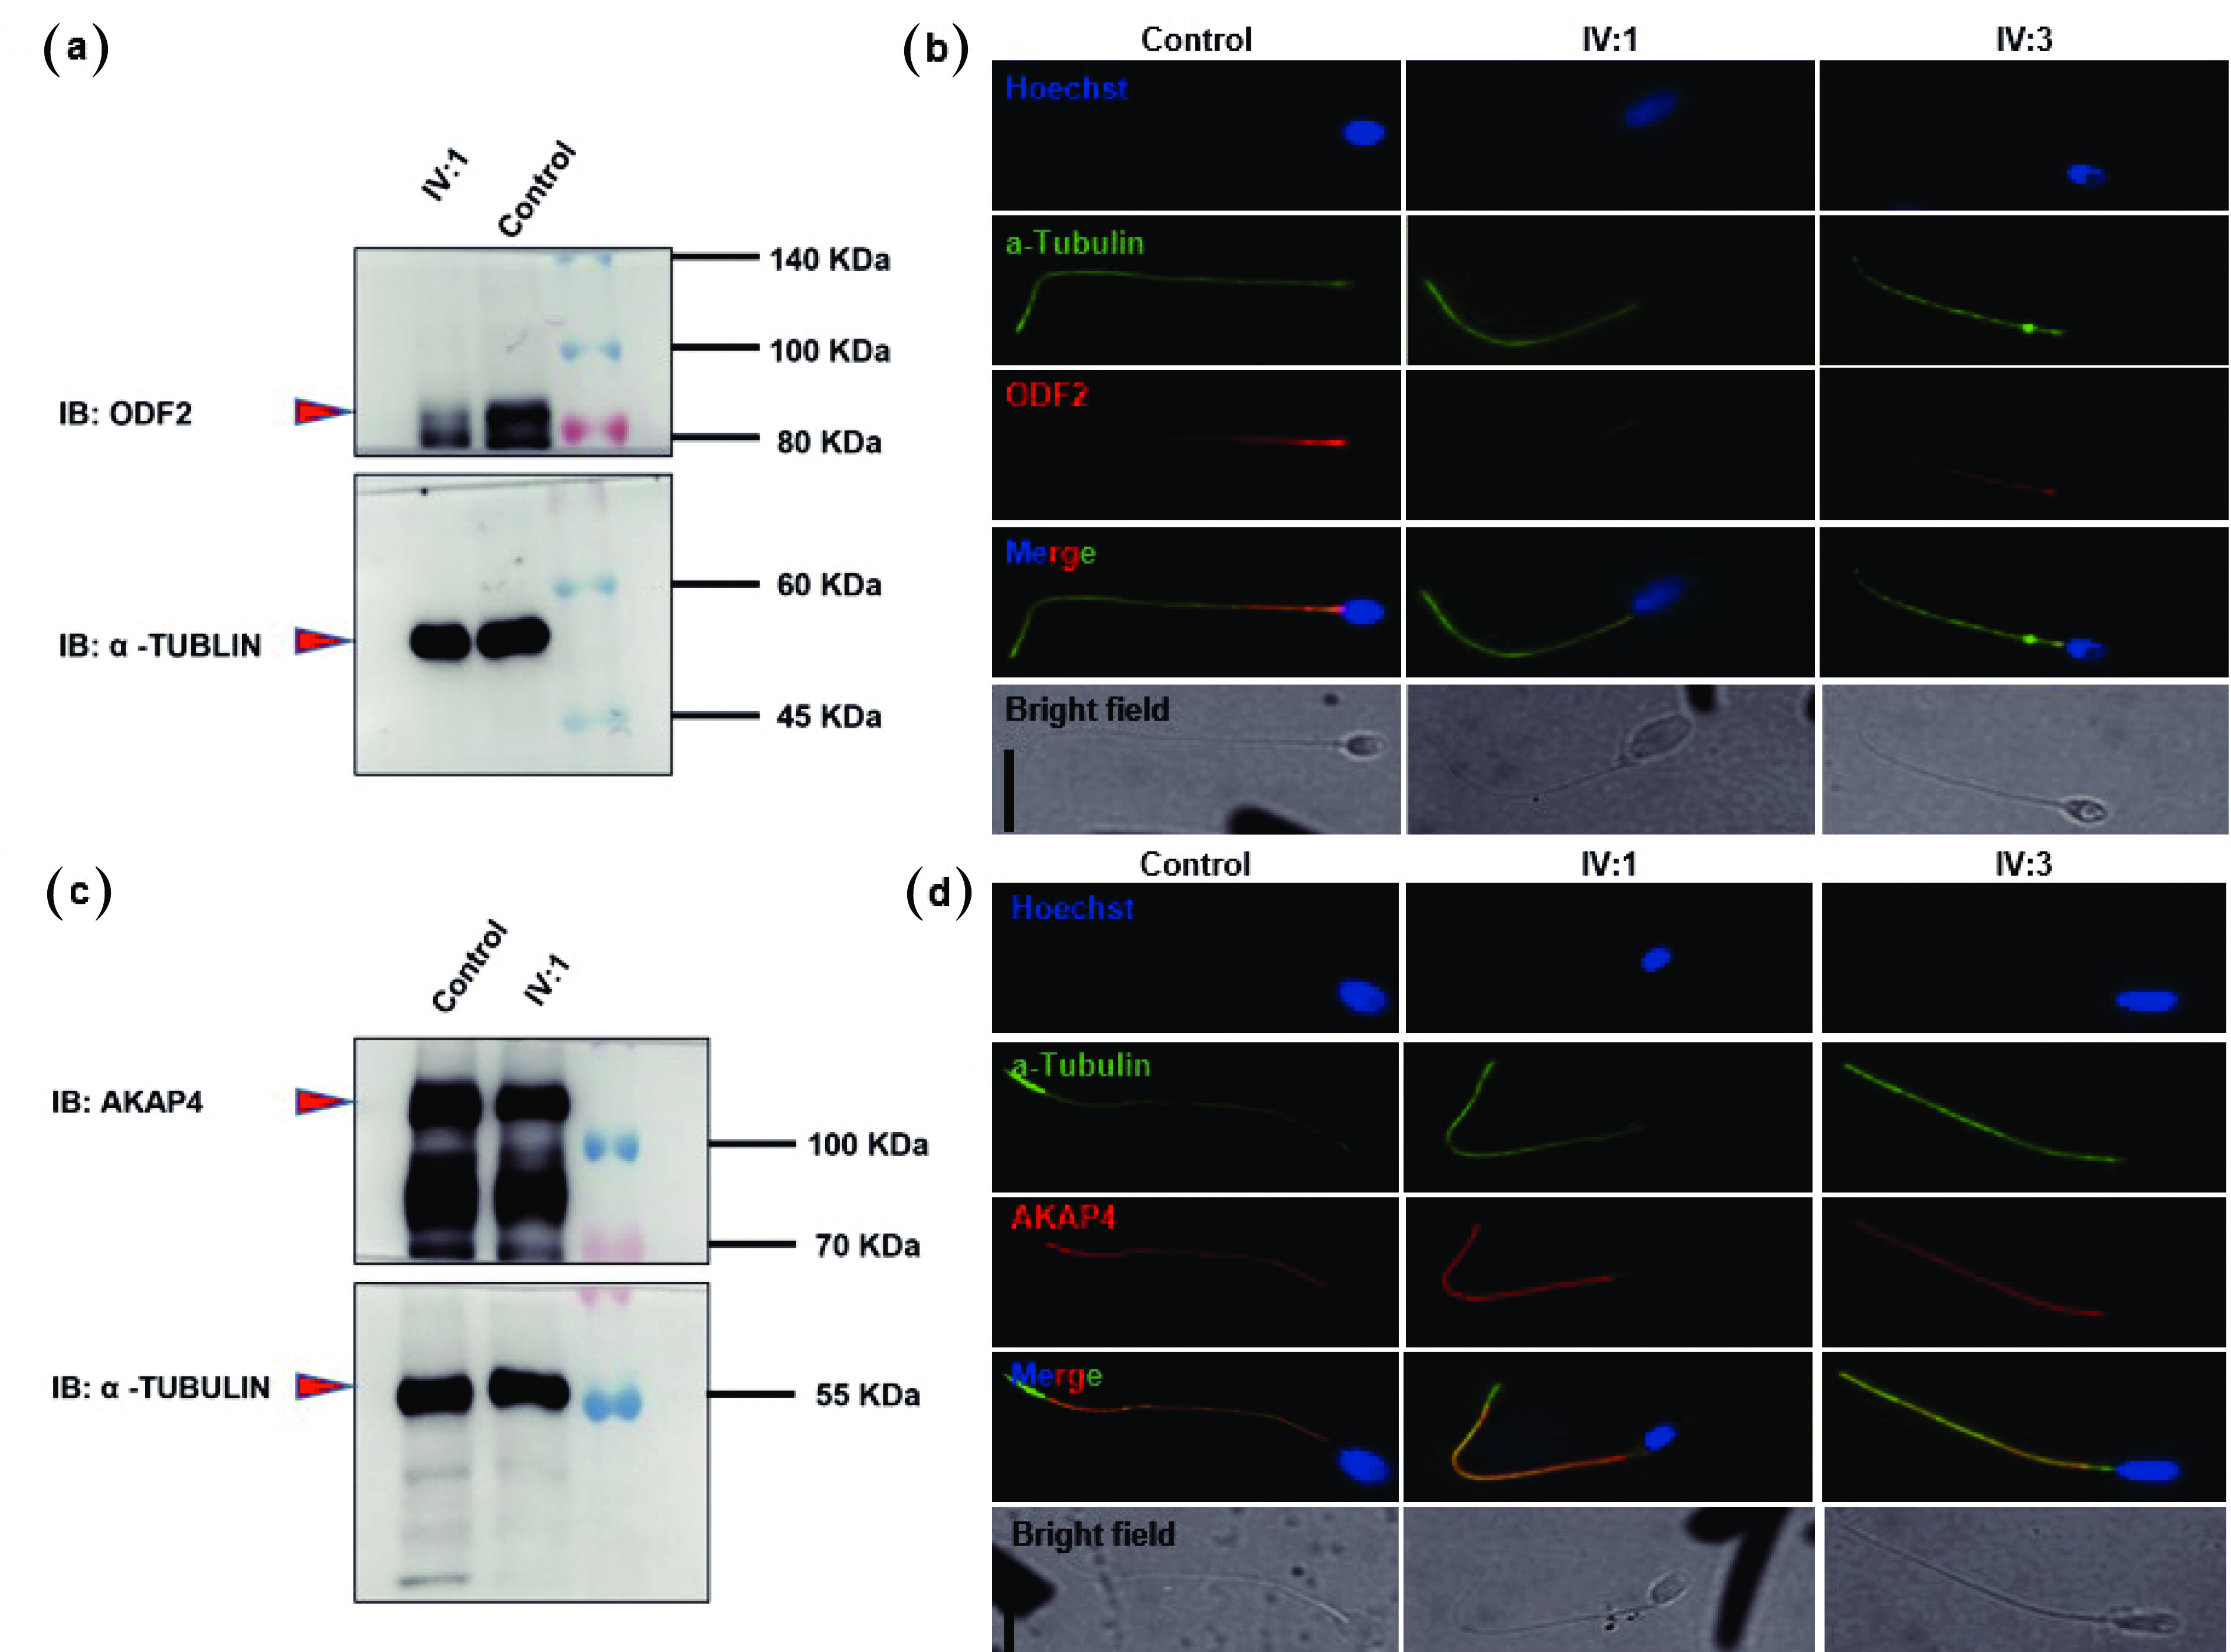
![]() Patients with the QRICH2 mutation presented reduced ODF2 and normal AKAP4 expression in their spermatozoa. Western blot analysis revealed the presence of a weak band of ODF2 (a) and an intact band of AKAP4 (c) in the sperm lysate of patient IV:1. Spermatozoa from normal fertile controls and patients (IV:1 & IV:3) were costained with anti-ODF2 and anti-AKAP4 antibodies. Images (b) and (d) show the corresponding fluorescence microscopy images of spermatozoa stained with anti-ODF2 and anti-AKAP4 antibodies, an anti-α-tubulin antibody (green), and Hoechst (a nuclear marker). The signals of ODF2 were weak (b), whereas normal signals of AKAP4 were detected in the spermatozoa of the patients (IV:1 & IV:3) (d). Scale bars = 10 µm. QRICH2: Glutamine-rich protein 2. ODF2: Outer dense fiber of sperm tails 2. AKAP4: A-kinase anchoring protein 4.
Patients with the QRICH2 mutation presented reduced ODF2 and normal AKAP4 expression in their spermatozoa. Western blot analysis revealed the presence of a weak band of ODF2 (a) and an intact band of AKAP4 (c) in the sperm lysate of patient IV:1. Spermatozoa from normal fertile controls and patients (IV:1 & IV:3) were costained with anti-ODF2 and anti-AKAP4 antibodies. Images (b) and (d) show the corresponding fluorescence microscopy images of spermatozoa stained with anti-ODF2 and anti-AKAP4 antibodies, an anti-α-tubulin antibody (green), and Hoechst (a nuclear marker). The signals of ODF2 were weak (b), whereas normal signals of AKAP4 were detected in the spermatozoa of the patients (IV:1 & IV:3) (d). Scale bars = 10 µm. QRICH2: Glutamine-rich protein 2. ODF2: Outer dense fiber of sperm tails 2. AKAP4: A-kinase anchoring protein 4.